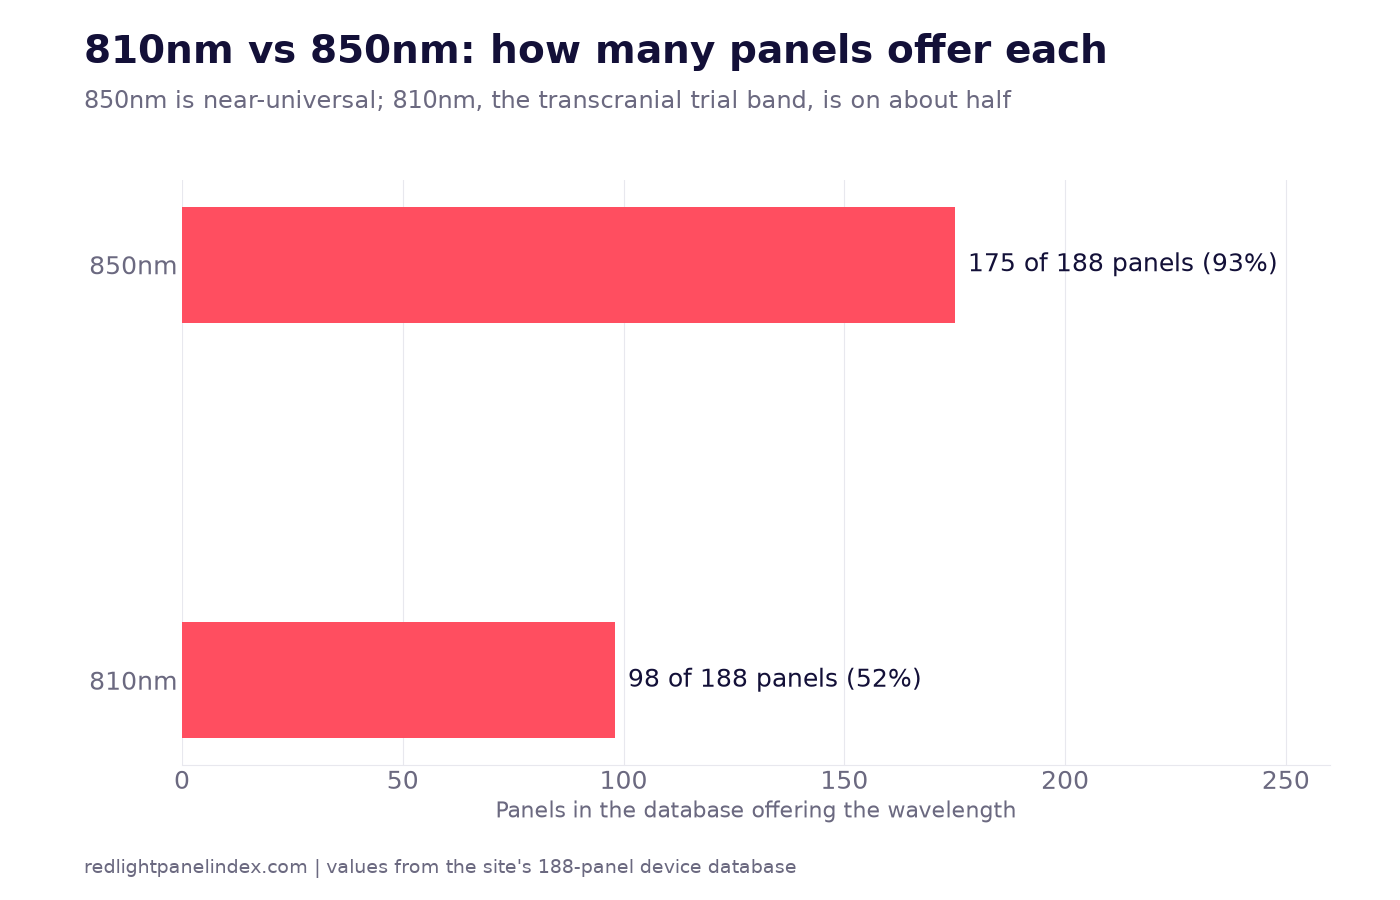
810nm and 850nm are neighbors in the near-infrared range, only 40 nanometers apart, and the practical difference between them for a home panel user is small. The difference that does exist is mostly about history and availability: 810nm is the wavelength most transcranial trials were built around, while 850nm is the near-infrared band that ships on 175 of the 188 panels in this site's database, 93 percent, against 98 of 188, 52 percent, for 810nm.
Choosing a panel? Our ranking of the best red light therapy panels is computed from published, method-labeled specs across 188 devices. For 810nm versus 850nm, the spec that matters is whether the panel publishes a density figure for the band you want, not just whether the wavelength is on the label.
The short answer
Both wavelengths sit in the near-infrared band, both are invisible to the eye, and both are absorbed by the same mitochondrial enzyme that this site's photobiomodulation page describes as the first step in the effect. Nothing in the evidence this site tracks shows 810nm producing a different kind of response than 850nm, or the reverse. If your panel has 850nm and not 810nm, you have not missed a separate category of light. If your panel has both, you have two neighboring bands that overlap in how far they travel through tissue.
What differs is how the studies were run. A large share of transcranial work, the research that points light at the head, was designed around 810nm, so the literature for that band is deeper on brain-related questions. 850nm, meanwhile, is the band behind many of the muscle and whole-body trials this site tracks, covered on the 850nm page. Choosing between them is less about biology than about which published protocol you are trying to approximate.
Why the two are so close
Near-infrared begins somewhere between 700 and 750 nanometers, a boundary the red versus near-infrared page explains. 810nm and 850nm both sit well inside it, and both fall in the stretch where tissue absorbs less than it does at red wavelengths, which is why near-infrared is the band associated with reaching below the skin surface. The calculated penetration trend in the computational modeling this site relies on is that longer wavelengths within the range panels use calculate out to greater depth (PMID 28900751). That model treats depth as rising with wavelength, so 850nm is calculated to reach marginally farther than 810nm, but a 40-nanometer gap is small next to the gap between 660nm and 850nm, which the 660nm versus 850nm comparison covers. This site's penetration depth page explains why the modeled figures are ceilings under specific conditions and not guarantees.
Where 810nm has the longer trial history
The clearest example is transcranial work, which the 810nm page covers on its own. A 2014 open-protocol study treated 11 people with chronic mild traumatic brain injury, ages 26 to 62, using red and near-infrared light-emitting diodes applied to the scalp for 18 outpatient sessions over six weeks, starting 10 months to 8 years after the injury (PMID 24568233). It was an open protocol, meaning there was no sham comparison group, so it describes what was observed in a small group rather than testing an effect against a control. It is cited here as an example of where transcranial trial history sits, not as proof that either wavelength produced a result.
That history matters for one reason: it is why 810nm shows up in so many research devices. The brain and mood evidence page grades this area Insufficient and notes that 810 to 830nm is the band most transcranial work uses, while stating that a wall panel is not a transcranial device and no home protocol is validated.
What the penetration measurements actually show
The most direct measurement relevant to 810nm comes from a 2015 review of near-infrared penetration. Its tissue studies found that low-level near-infrared energy did not penetrate 2 millimeters of skin or 3 centimeters of skull and brain, and that at 10 to 15 watts, 0.45 to 2.90 percent of 810nm light penetrated 3 centimeters of tissue (PMID 26346298). Those are research-laser power levels, far above anything a home panel delivers, which is the point worth taking from the study. Even the wavelength with the strongest transcranial track record transmits only a small fraction of its energy through that much tissue, so a panel's choice between 810nm and 850nm is not what limits how much light reaches deep structures. Distance, power and the tissue in the way matter more.
What the database shows
The wavelength lists on database pages make the availability gap concrete. Three panels show how the two bands are handled:
| Model | 810nm share | 850nm share | Notes |
|---|---|---|---|
| Mito Red Light MitoPRO 1500X | 17% | 17% | Six wavelengths; 830nm also 17% |
| RLT Home Total Spectrum ULTRA | 20% | 8% | Seven wavelengths; 830nm 13% |
| PlatinumLED BioMax 900 | not itemized | ~36% | Seven wavelengths; 810nm listed without a share |
The MitoPRO 1500X splits its three near-infrared bands evenly, 17 percent each. The Total Spectrum ULTRA weights 810nm more than 850nm, 20 percent against 8 percent, which is the reverse of what most panels do given how common 850nm is. The BioMax 900 lists 810nm among its wavelengths but does not itemize its share, so the page supports a statement that the band is present, not how much of the output it carries.
This is the practical reading rule: a wavelength list tells you a band is present, and only a published share or density tells you how much of the panel's output sits there. The wavelength and FWHM page explains why a peak number alone is not enough to compare panels. Irradiance figures also carry a method label that matters; the irradiance explainer covers how to read them. Some of the numbers on these pages are measured by independent spectrometer and some are manufacturer claims, and the two can differ widely.
Does the 40-nanometer gap change dose?
Not in a way the evidence supports quantifying. Dose is energy per unit area, set by irradiance and session time, and the dose calculator works from those two inputs rather than from a wavelength-specific formula. If you are following a protocol written for 810nm and your panel only offers 850nm, the useful step is to find your panel's measured irradiance at the distance you will sit, compute the session time that delivers the protocol's energy density, and treat the result as an approximation. The trials this site has reviewed do not support a correction factor between the two bands, and one should not be invented.
What 810nm adds and what it does not
| Question | 810nm | 850nm |
|---|---|---|
| Share of database panels offering it | 98 of 188 (52%) | 175 of 188 (93%) |
| Trial history | Longer, especially transcranial | Many muscle and whole-body trials |
| Calculated depth trend | Slightly shallower | Slightly deeper |
| Evidence it works better | Not shown | Not shown |
Verdict by use case
- You want a panel for muscle, joints or general recovery: 850nm is on almost every panel and is the band behind much of the muscle-related work, so its presence is a given. Look at the published share at 850nm and the measured irradiance rather than at 810nm.
- You want to approximate a transcranial protocol: 810nm is the band the research devices used, but the brain and mood evidence is graded Insufficient and a wall panel is not a validated substitute. A panel with 810nm does not close that gap.
- You are comparing two panels with the same budget: prefer the one that publishes shares or density for every near-infrared band over the one that lists more wavelengths without numbers.
- You are deciding whether 810nm is worth paying more for: nothing in the sources used here shows a panel with 810nm outperforming one without it, so treat it as a feature, not a requirement.
Use the panel database to filter by wavelength and compare published figures band by band. The even rarer 1064nm band is covered in 850nm versus 1064nm.