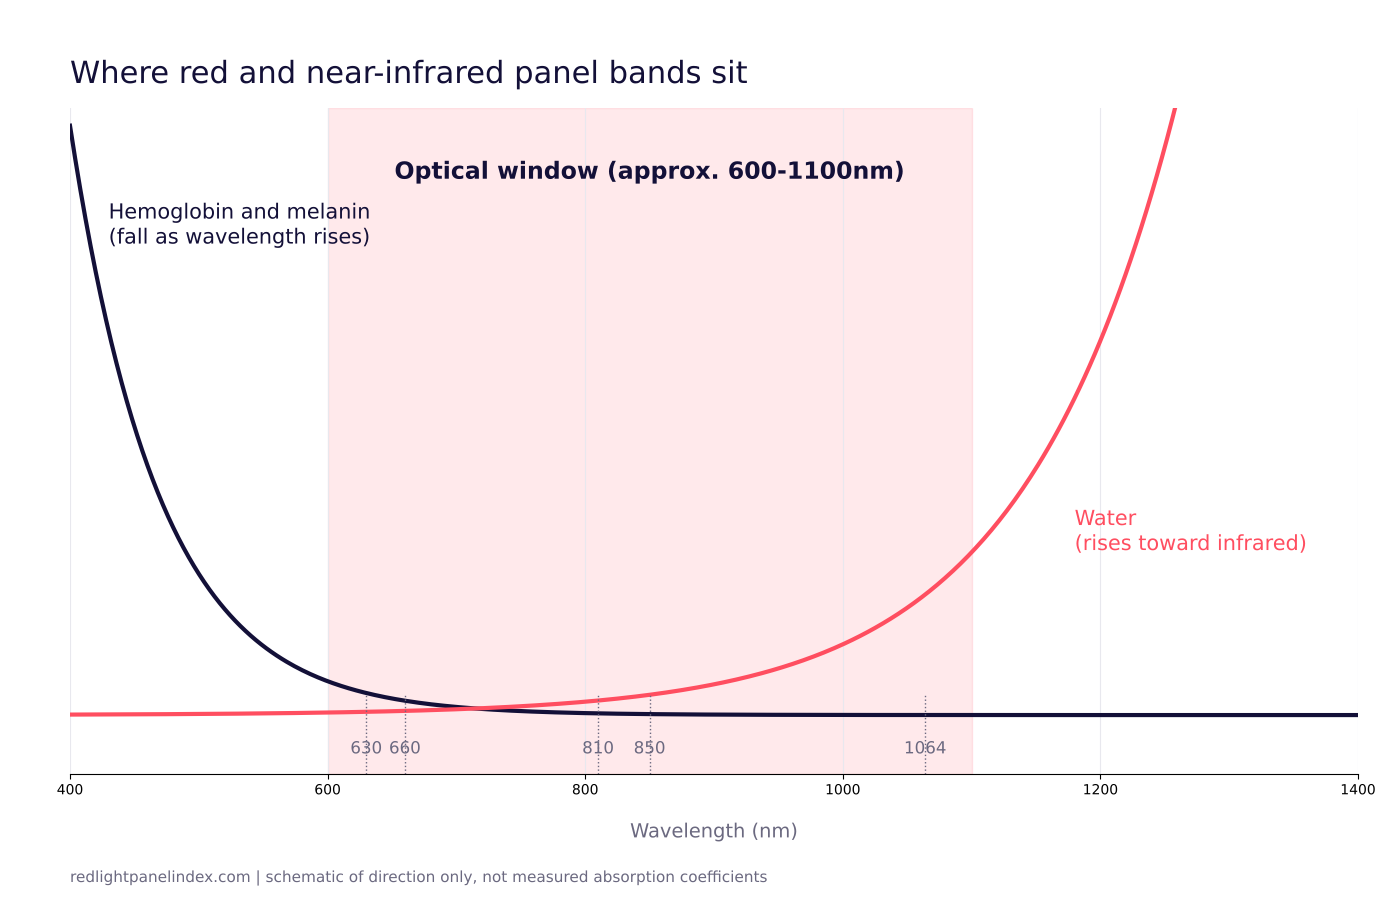
The optical window, sometimes called the therapeutic window, is the band of the spectrum, usually described as roughly 600 to 1100nm, where the main light absorbers in tissue take up the least light, so red and near-infrared photons can travel past the skin surface instead of being used up in the first fraction of a millimeter. It is bounded on the short side by hemoglobin and melanin and on the long side by water, and almost every wavelength a home panel offers was chosen to sit inside it.
Choosing a panel? Our ranking of the best red light therapy panels is computed from published, method-labeled specs across 188 devices. For the optical window, the spec that matters is which wavelengths a panel actually carries inside it, and at what share of its LEDs.
What "window" means
Light entering tissue meets molecules that absorb it. Our page on chromophores covers each one in turn. The short version is that hemoglobin in blood and melanin in skin absorb strongly at shorter wavelengths and less as you move toward red and near-infrared. Water makes up most of tissue and absorbs more as wavelength increases into the infrared.
Put those two trends on one axis and there is a valley between them. On the left, blood and pigment have mostly dropped off. On the right, water has not yet taken over. That valley is the window. The numeric edges are a convention rather than a hard cutoff: absorption changes gradually, which is why sources quote the window as approximate, and why this site's chromophore page does not publish absorption coefficients for any of the four absorbers. The figure of 600 to 1100nm in the title is the commonly used rough range, not a measured boundary.
The principle is a standard part of the dosimetry background in the photobiomodulation literature. A widely cited review of the field, "The nuts and bolts of low-level laser (light) therapy" (PMID 22045511), covers the mechanisms of action, the light sources used and the principles of dosimetry, and notes that the wavelengths in use have broadened beyond lasers to LEDs across the red and near-infrared. Its abstract does not give numeric window edges, so none are attributed to it here.
Why the left edge sits near red
Below the window, visible light is absorbed within roughly the first millimeter of skin. That is useful for surface work and is the reason blue light is discussed for skin-surface questions, but it does not deliver much dose below the surface. By the time the spectrum reaches the red end, absorption by blood and pigment has fallen enough that a meaningful fraction of the light continues inward.
This is also where skin tone matters. More melanin means more light absorbed near the surface and less delivered deeper, and the effect is stronger at the shorter, red end of the window than at the near-infrared end. A panel does not know who is standing in front of it, so the same output produces a different delivered dose from person to person. Use the dose calculator for the surface arithmetic and treat any result as an upper bound on what arrives below the skin.
Why the right edge is not a "go deeper" signal
It is tempting to read the window as a ramp in which longer always means deeper. The window has a ceiling. Water absorbs more as wavelength increases into the infrared, so a longer wavelength is not simply a deeper one. Our 850nm vs 1064nm page states this directly and gives no numeric water-absorption figure for either band, because neither the site nor its sources support one.
What the modeling literature does support is a general trend. A 2017 Monte Carlo study of a layered skin model (PMID 28900751), summarized on our penetration depth page, found that calculated penetration depth increased with increasing wavelength, with the deepest wavelength tested reaching a maximum calculated depth of about 5.4 millimeters. That is a modeled ceiling for one scenario, not a guarantee for any panel or person.
Measured transmission in tissue is far lower than the headline depth suggests. A 2015 review (PMID 26346298), also summarized on that page, reported that at 10 to 15 W, 0.45 to 2.90 percent of 810nm light reached 3 centimeters, and that a 980nm source delivered about 1.22 percent at that depth. Those are high-power laboratory conditions, well above a typical home panel, and different sources use different cutoffs for "reached," so the numbers should not be compared across methods.
Where common panel wavelengths sit
Our wavelengths overview lists the bands home panels carry. Placed against the window:
| Band | Where it sits | What the site says it is used for |
|---|---|---|
| 630nm and 660nm red | Near the short edge | Surface skin and collagen; 660nm is the most common band |
| 810nm, 830nm and 850nm near-infrared | Middle of the window | Muscle, joints and transcranial research; 850nm is heavily weighted by most brands |
| 1060 to 1064nm | Near the long edge | The deepest home-panel band; see below |
The 810nm vs 850nm page compares the two near-infrared standards. Its modeling note is that 850nm is modeled slightly deeper than 810nm, which is consistent with the general trend, but the difference is small next to the variation between people.
What this means for 1064nm
The 1064nm band is the one that most invites the "deeper" assumption, so it is worth being precise. Per our 1064nm page, only two brands carry it at a meaningful share of LEDs: Helio Blaze at 16.7 percent and RLT Home Total Spectrum MAX at 14 percent. Other brands list a 1060nm band at densities too low to qualify. Both figures are LED share, not delivered energy.
The research behind the band is thin for home use. The 1064nm studies we cite were laser research on healthy adults with the beam applied to the head, not tests of a wall panel or of any condition. See our review of the 1064nm transcranial cognition trial for what that work did and did not show. If you want to compare the brands that carry the band on the same criteria, the best deep-tissue 1064nm panels ranking applies one method to all of them, and how rankings work explains the criteria.
What the window does not tell you
- It does not set a dose. Being inside the window means light can get in, not that any amount is right. Dose is irradiance multiplied by time at the skin, and irradiance figures are only comparable when the measurement method is stated. See irradiance.
- It does not rank wavelengths for a condition. The window explains why red and near-infrared are used at all. Which band suits a given question is a matter for the trials on that condition, which the evidence hub grades separately.
- It is not a fixed line. Skin thickness, fat layer, hydration, pigment and beam geometry all shift how much light arrives at a given depth.
- It is not a safety statement. Near-infrared is invisible and skin warmth is common. Anyone with a medical condition or taking a photosensitizing medication should talk with a clinician first.
How to use this when comparing panels
- Check that the bands a panel advertises fall inside the window. Nearly all do; a panel that leans on a band far outside it needs a reason.
- Look at the share of LEDs or the stated density per band, not just the number of bands listed. A long list of wavelengths with a tiny share each adds little.
- Prefer method-labeled irradiance over a bare number, and remember that a total-output figure is not a per-band figure.
- Treat depth claims as ceilings from models and laboratory setups, not as results for your tissue.
Summary
The optical window is a plain idea with a limited job: it explains why the red and near-infrared bands, and not blue or far infrared, are the ones used in panels. Hemoglobin and melanin thin out on one side, water rises on the other, and the useful range sits between them at an approximate 600 to 1100nm. Inside it, small differences in wavelength matter much less than dose, distance, skin tone and the quality of the irradiance figure behind the claim.