Blog: Guides, Science and Evidence Updates
Every article on the index, newest first. 73 articles.
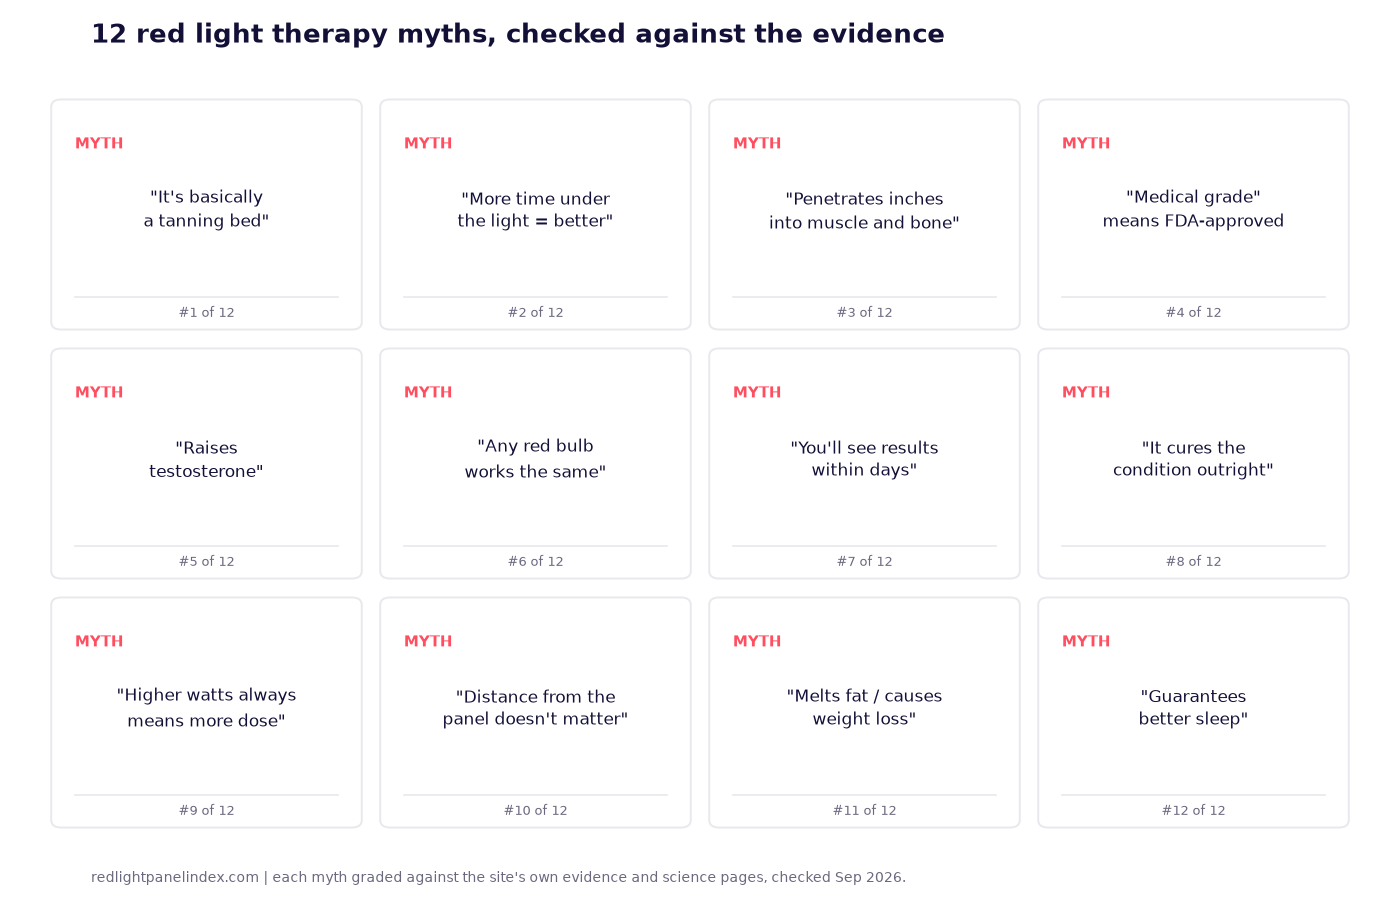
12 Red Light Therapy Myths, Checked Against the Evidence
Tanning, testosterone, "penetrates inches" and nine more red light therapy claims, checked against the trials and pages that actually address them.
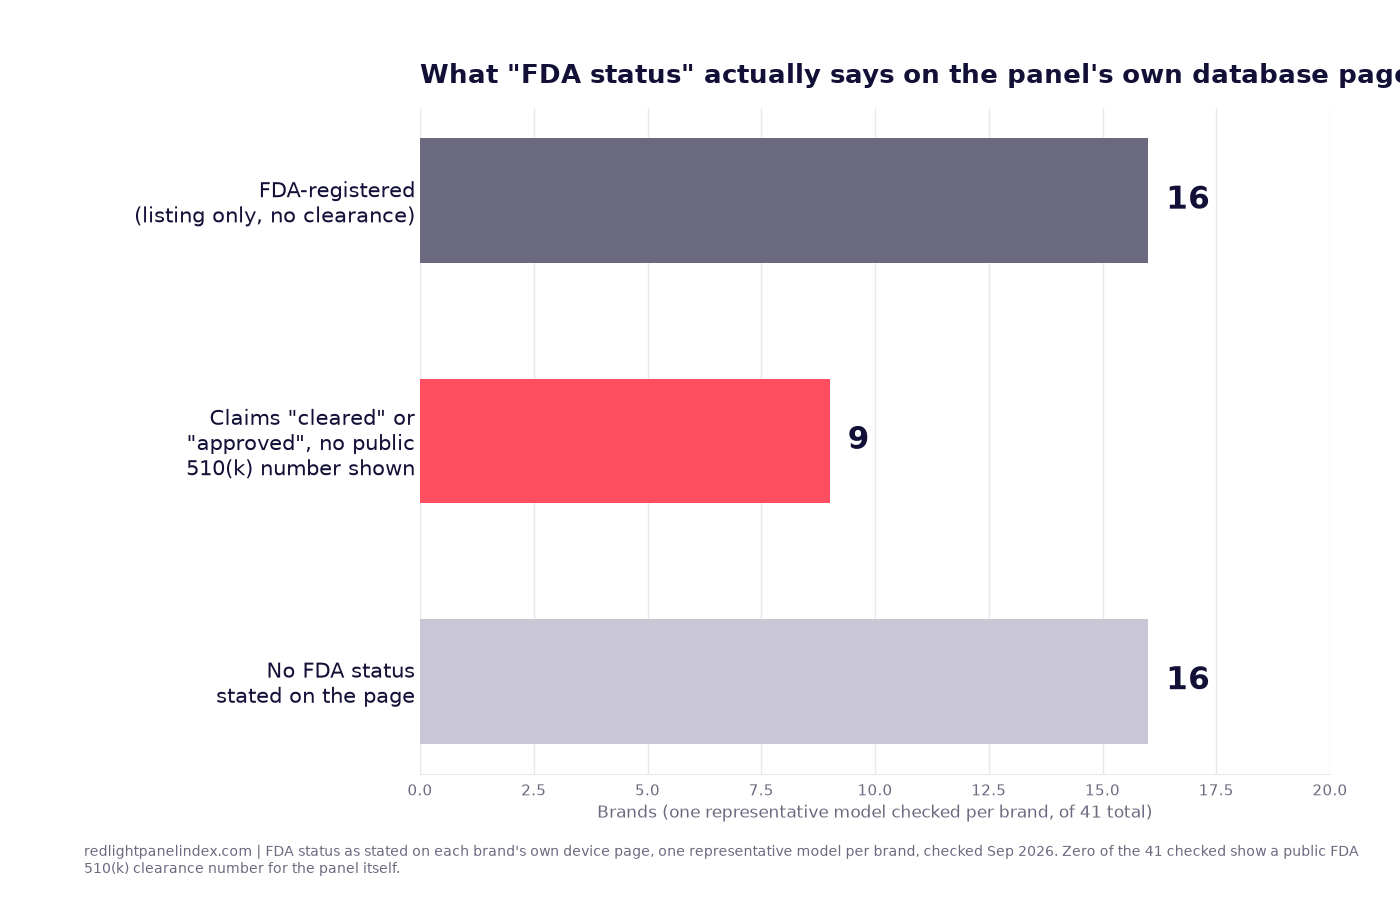
'Medical Grade' Red Light Panels: An Audit of the Claim
Medical grade
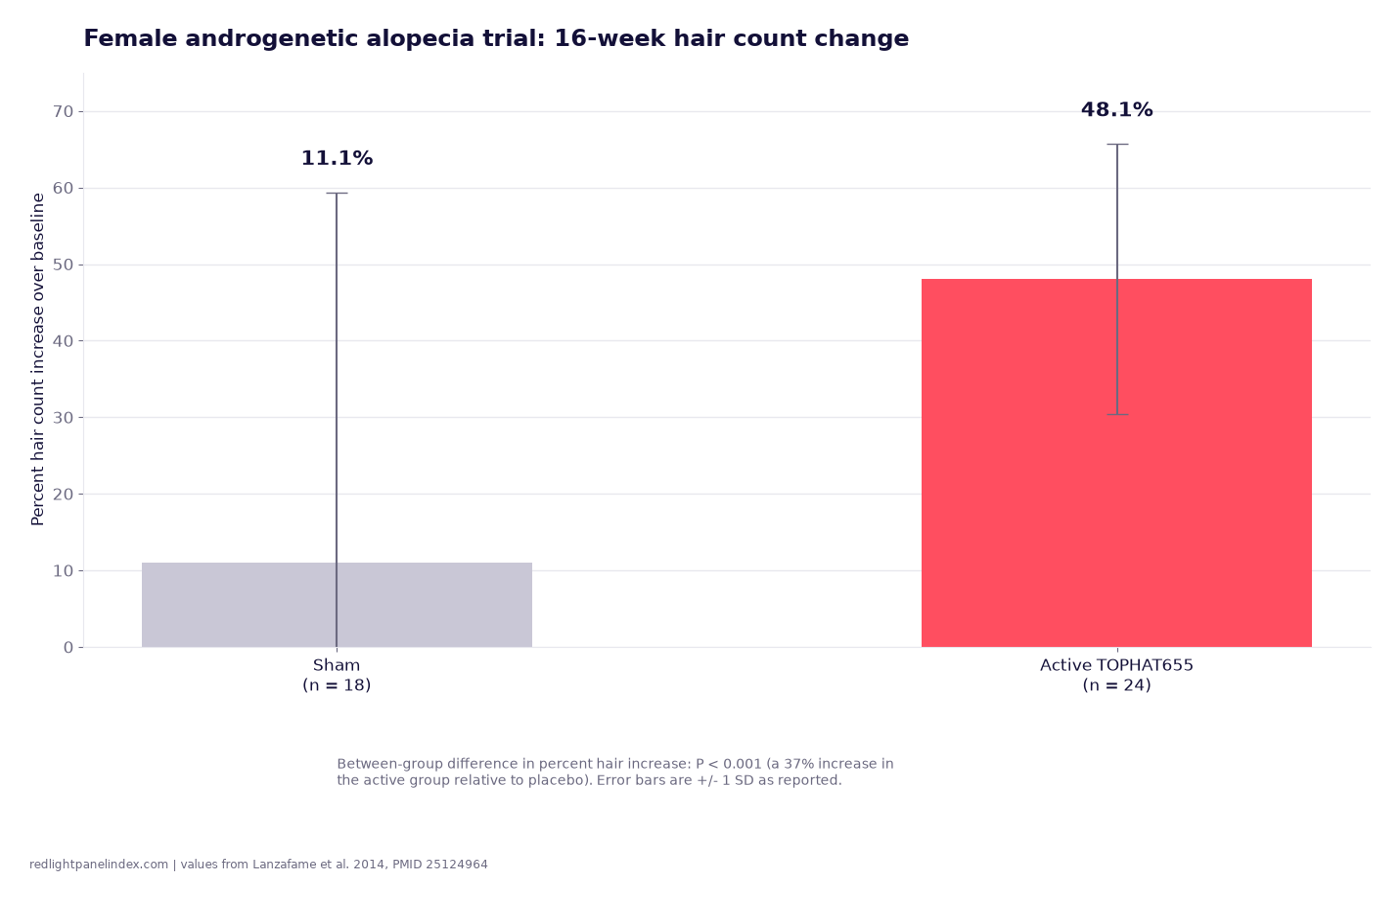
Study Review: The Lanzafame Female Hair Growth Trial (2014)
The companion trial to the 2013 male study, same helmet device, in 47 women. A 37% hair count increase versus sham, and what differed.
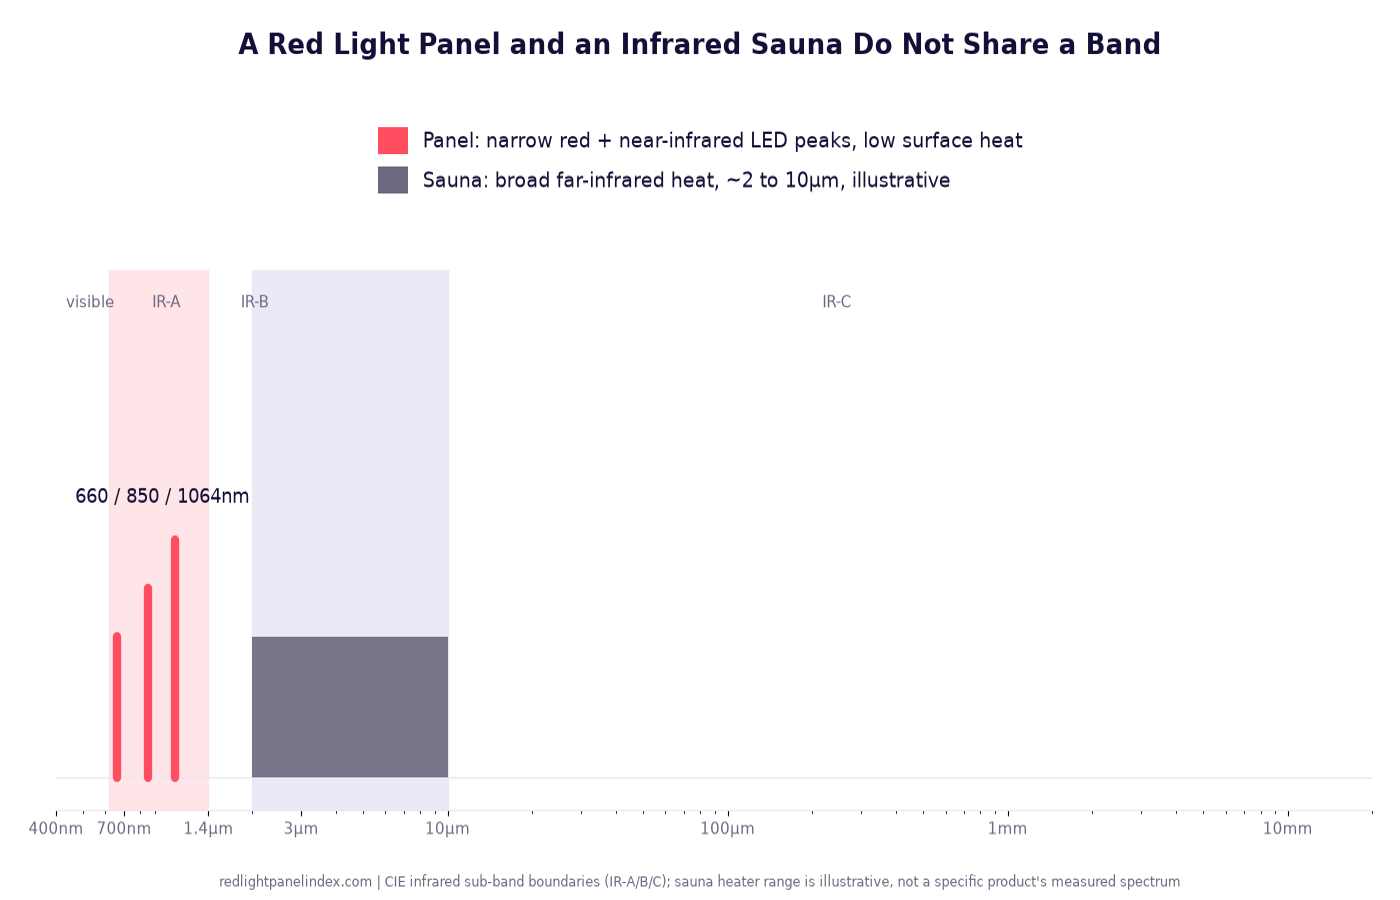
Red Light Panel vs Infrared Sauna: Photons vs Heat
A panel delivers narrow red and near-infrared photons at low heat. A sauna delivers broad far-infrared heat. Different bands, different jobs.
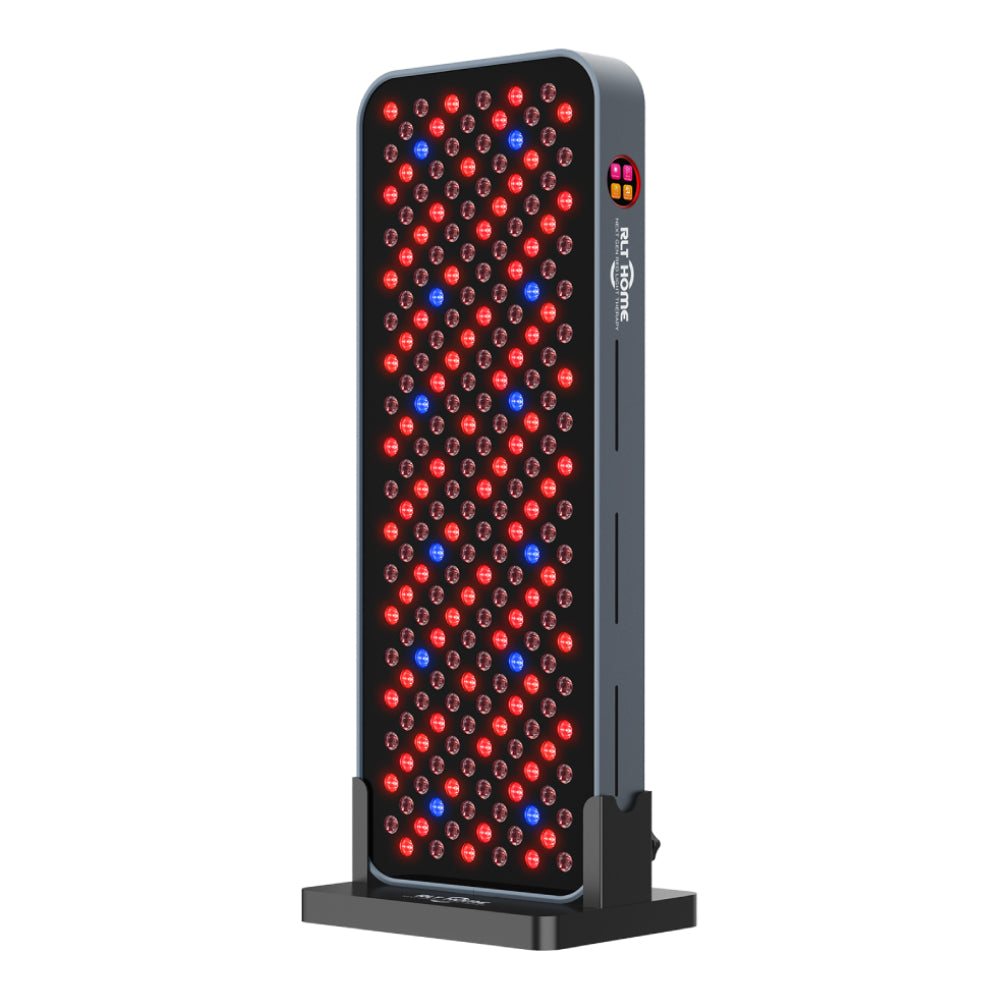
Best Red Light Devices for Hair Growth
The trial evidence for hair growth comes from dedicated scalp caps, not panels. This site's database tracks no caps, so here is how the panels rank.
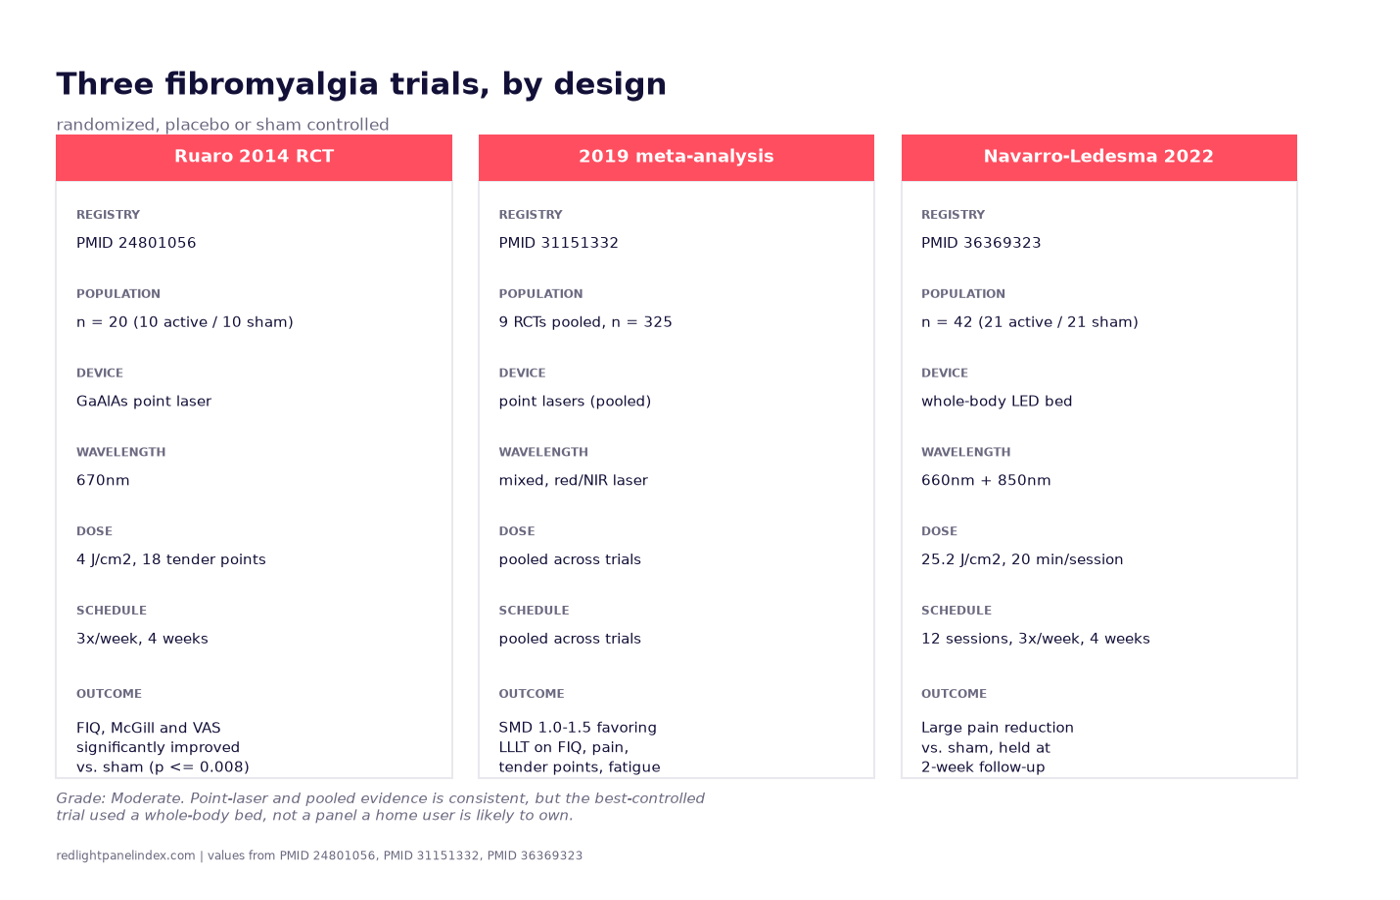
Red Light Therapy for Fibromyalgia: What the Trials Tested
A point-laser RCT, a 9-trial meta-analysis and a whole-body LED bed trial. Grade Moderate, and what home panels cannot copy.
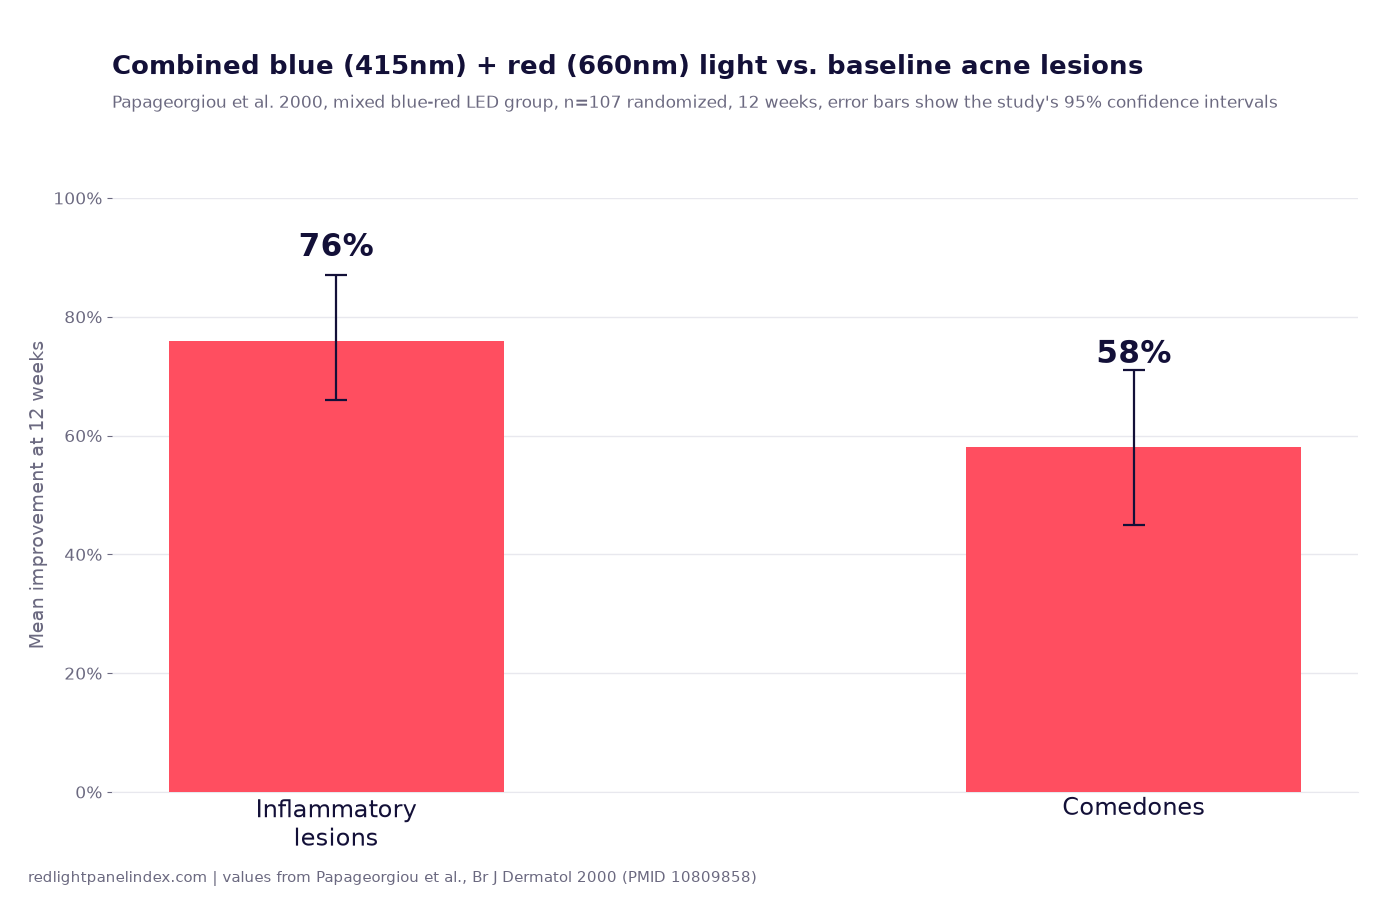
Study Review: Blue 415nm + Red 660nm Light for Acne (2000)
The foundational four-arm acne trial behind the blue-plus-red case, and why a red-only panel is not the device it tested.
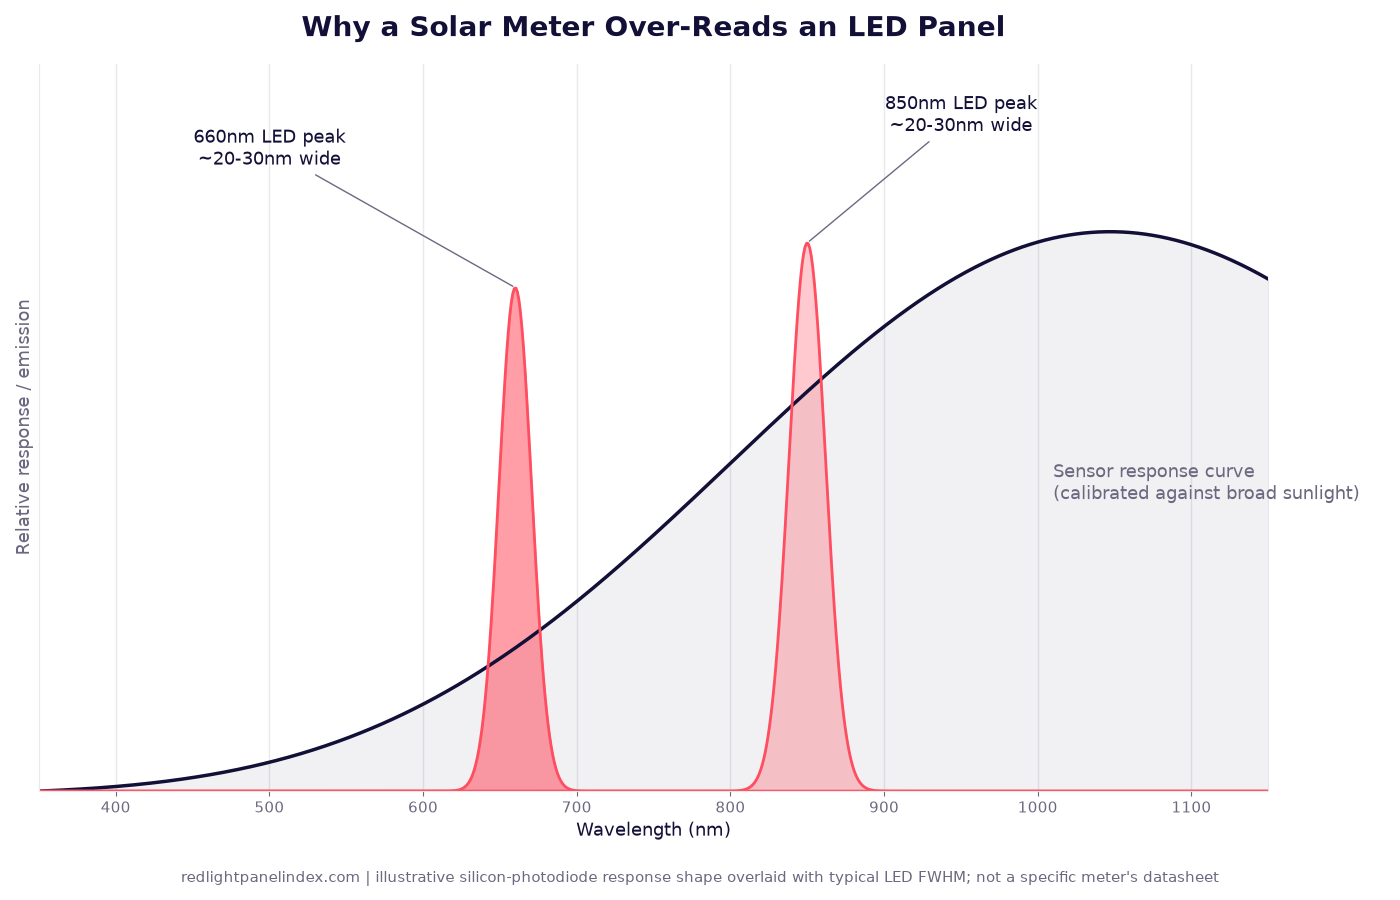
What a Solar Power Meter Measures (And Why Brands Use One)
A solar power meter is a broadband silicon-photodiode sensor built for sunlight, not narrow LED peaks, and that mismatch is why its readings run high.
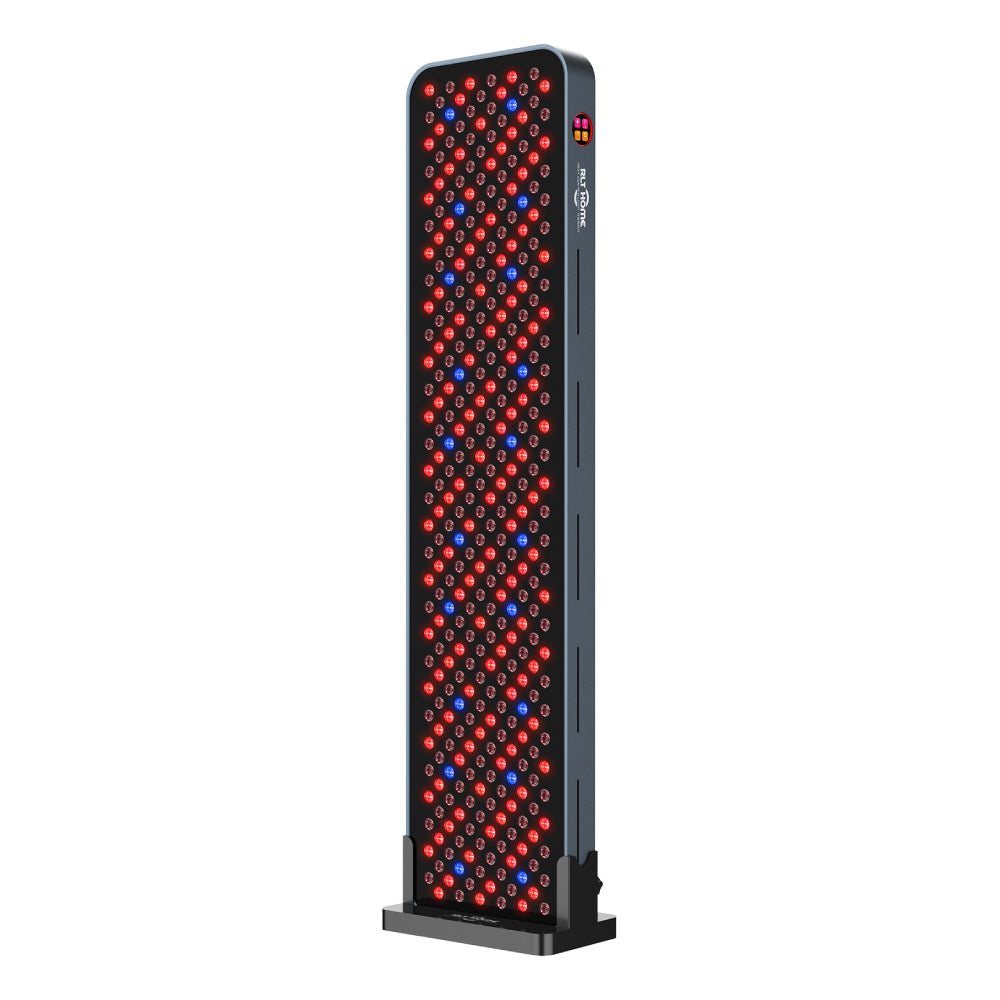
Highest-Irradiance Red Light Panels (Method-Labeled Only)
Four panels ranked on spectrometer-measured irradiance, not marketing claims, with why a bigger number does not always mean a better session.
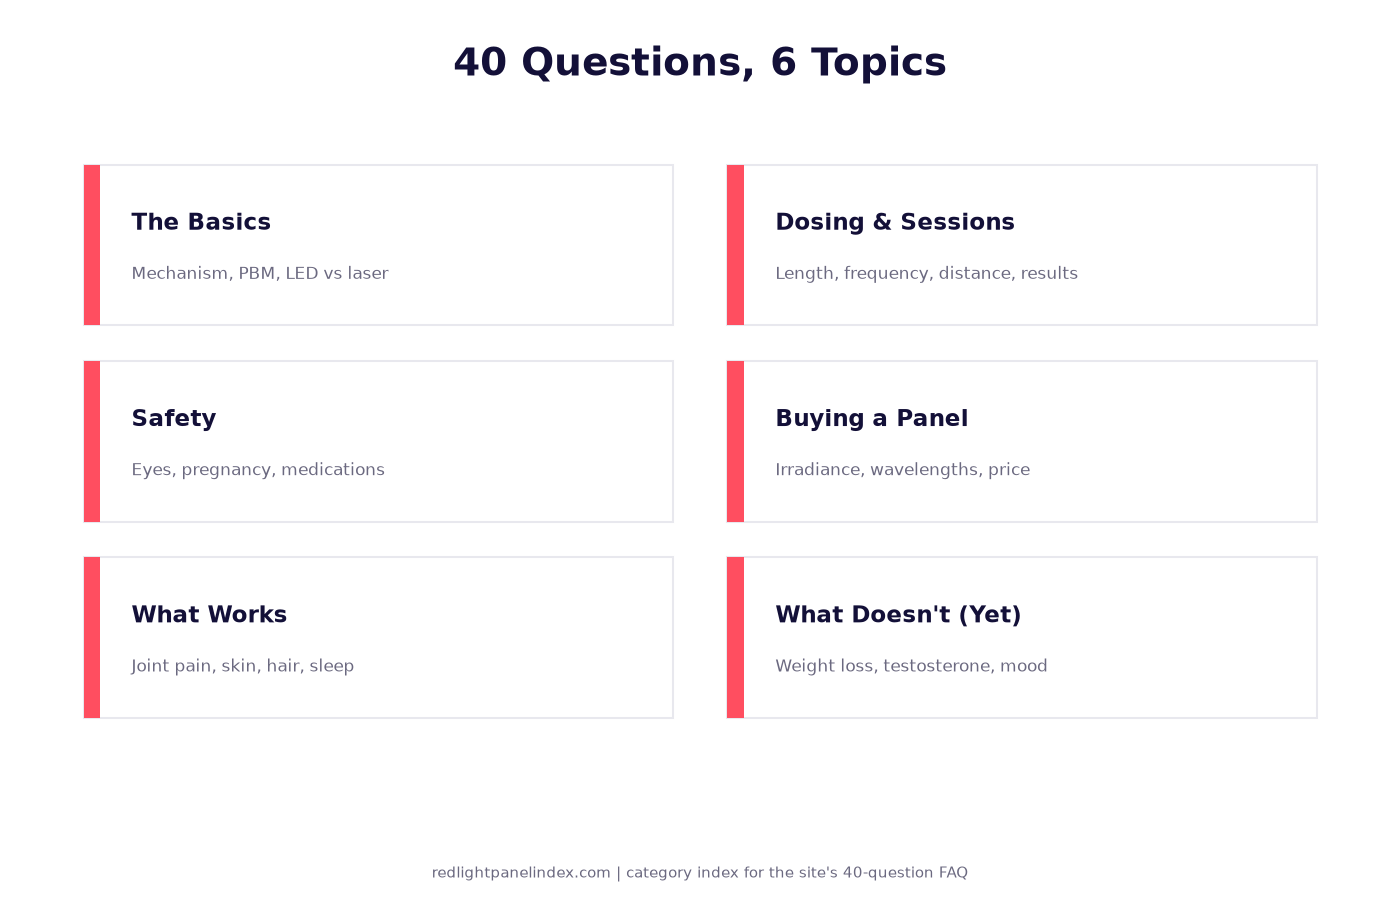
Red Light Therapy FAQ: 40 Questions Answered
Forty short, sourced answers on how red light therapy works, dosing and safety, buying a panel, and what the evidence supports for each condition.
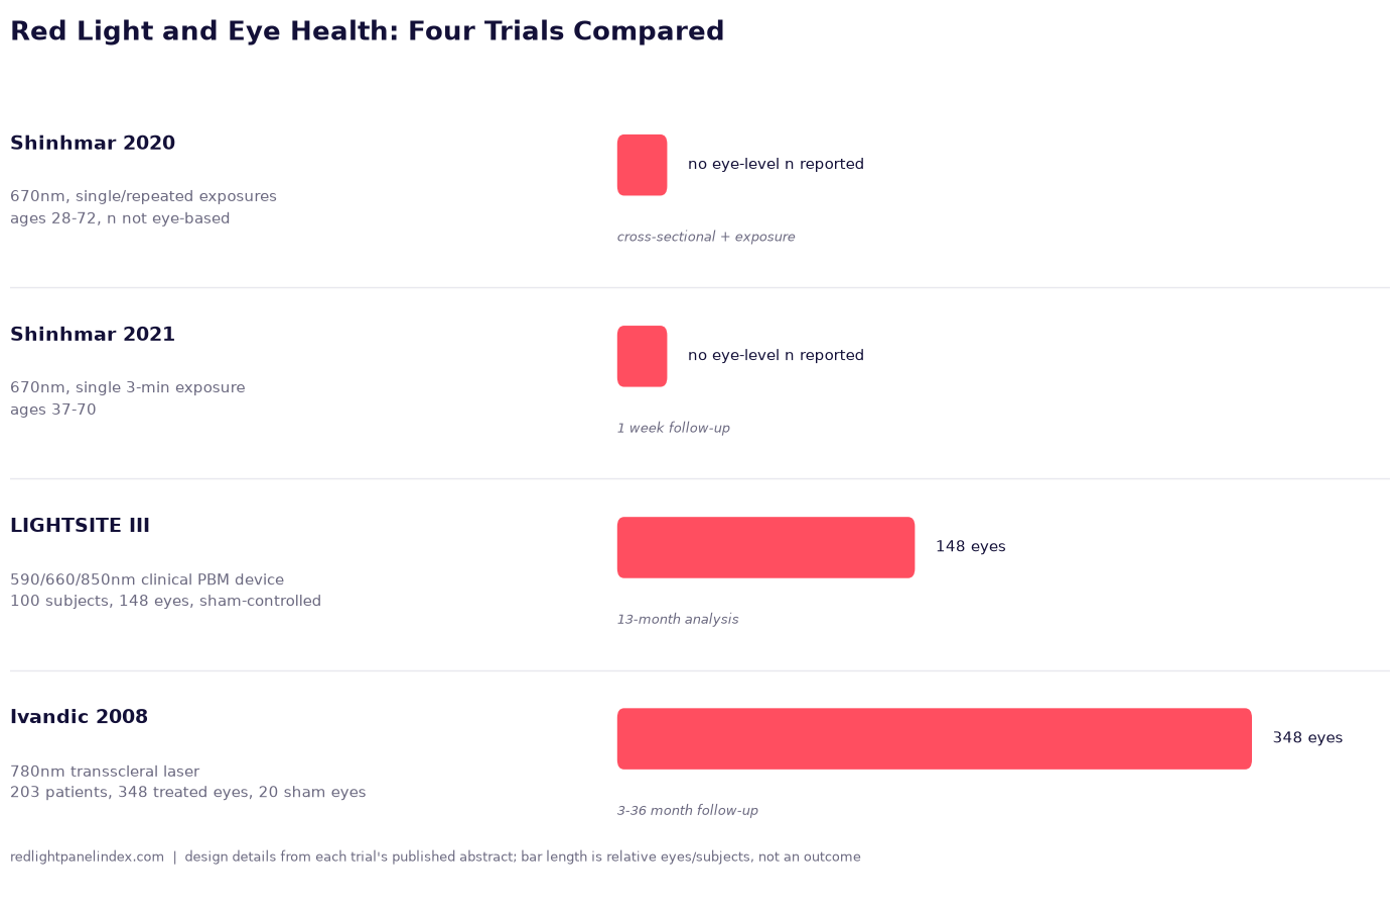
Red Light and Eye Health: The 670nm Research, Carefully
Limited evidence from small 670nm vision trials and older AMD studies, all using controlled clinical light sources, not home panels.
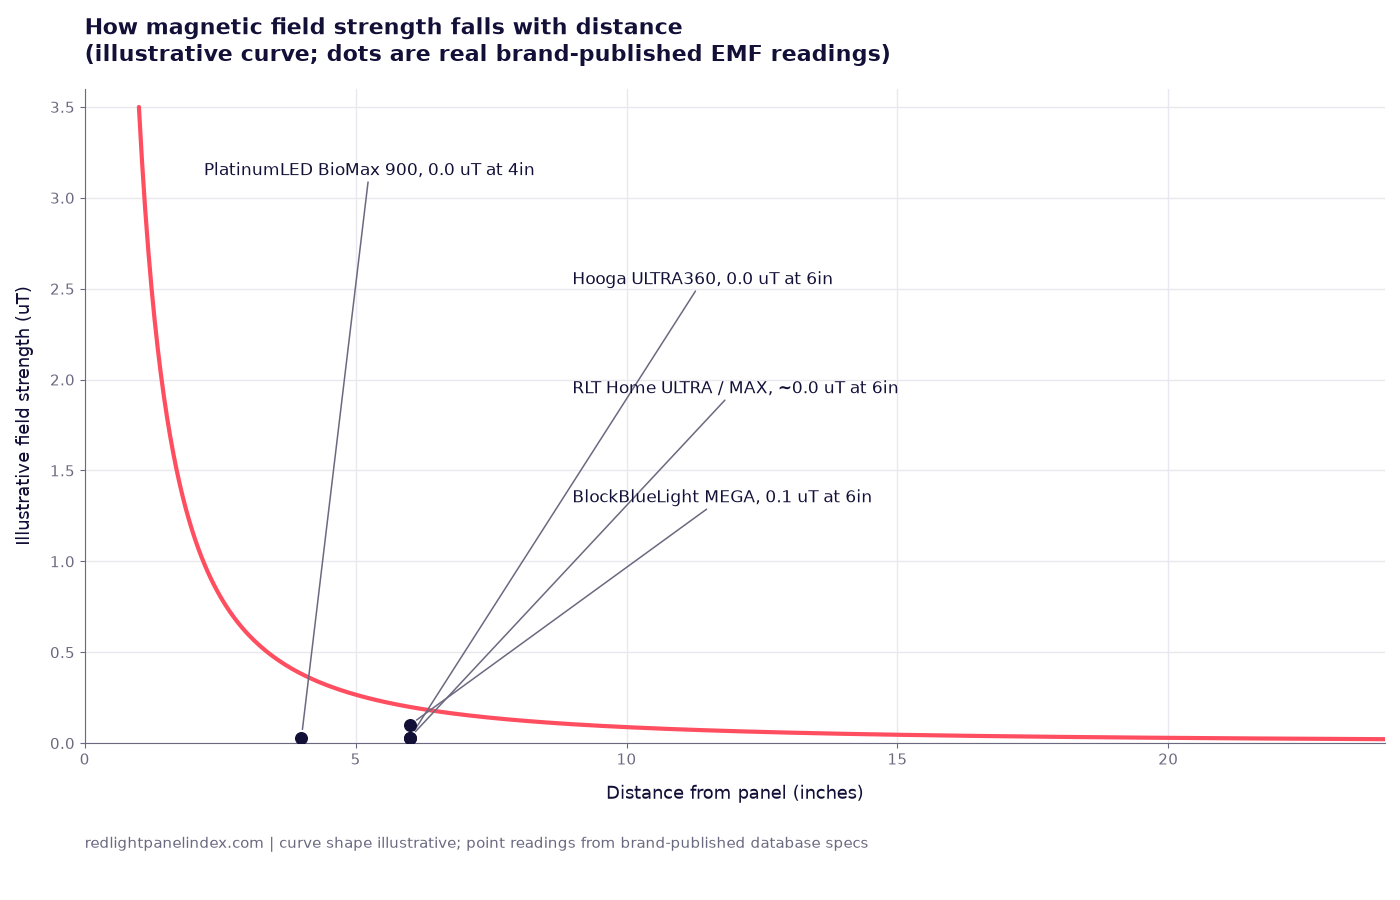
EMF in Red Light Panels: Claims vs Measurements
What kind of EMF a panel produces, how it falls with distance, how brands measure it, and what this site's database shows brand by brand.
Best Red Light Panels for Athletes and Muscle Recovery
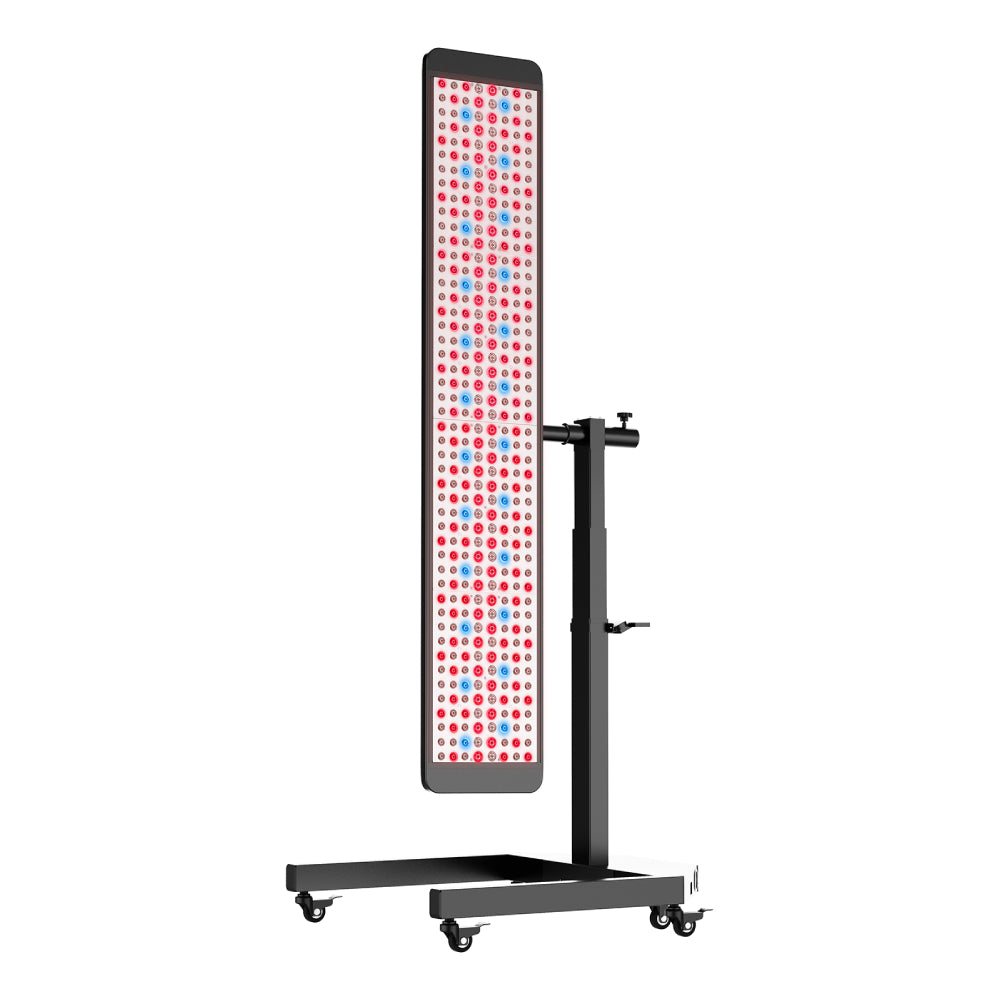
Panels ranked for athlete recovery on published 810-850nm near-infrared density, method-labeled irradiance for standing use, coverage and price.
The Beginner's 30-Day Red Light Protocol
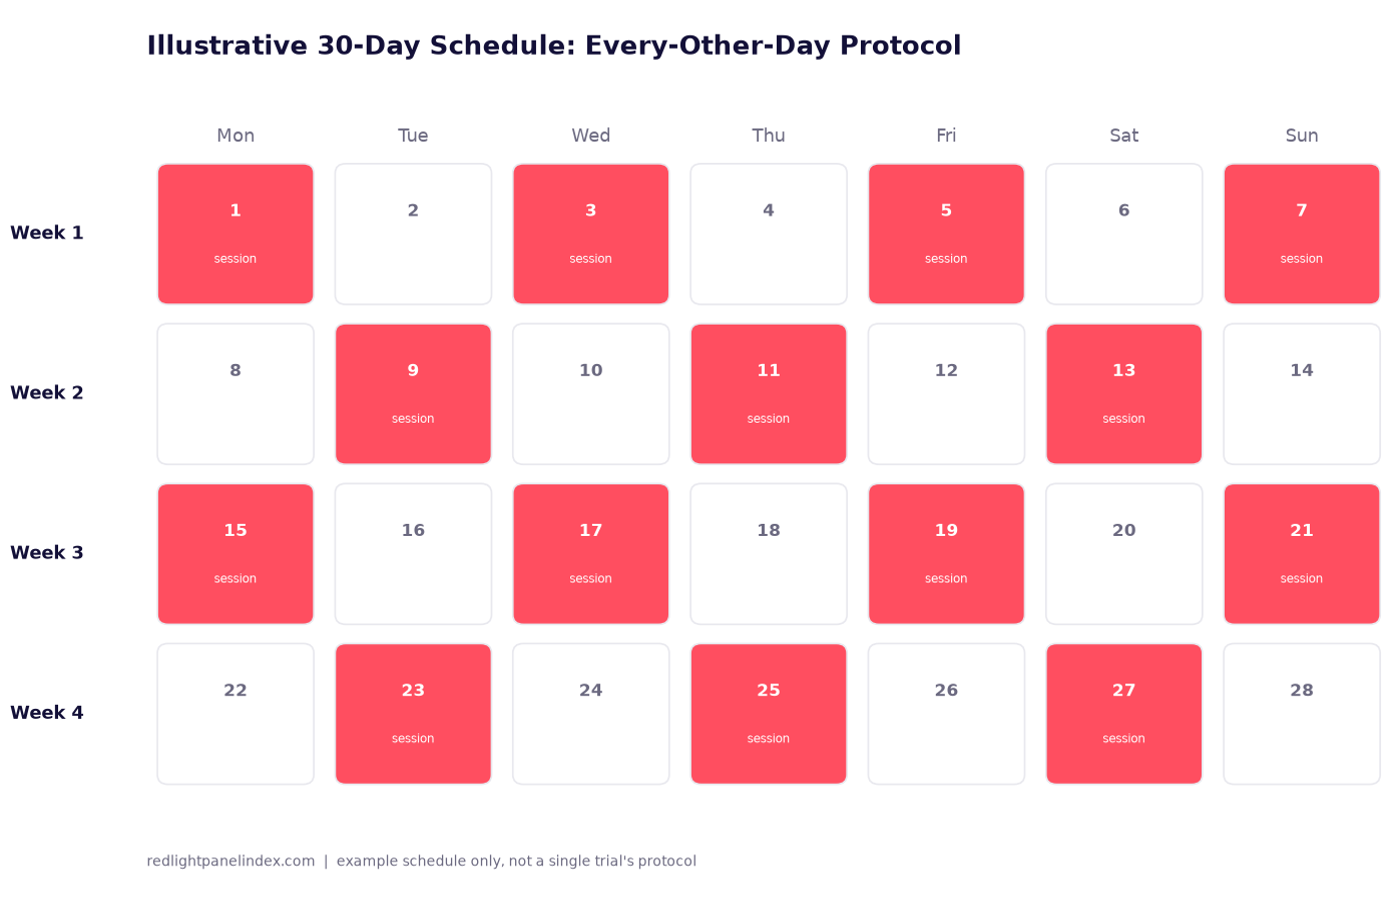
A four-week plan that turns frequency, session length and distance guidance into a printable schedule, with each figure linked to its source.
Study Review: Laser Therapy for Chronic Low Back Pain, 2016 Meta-Analysis
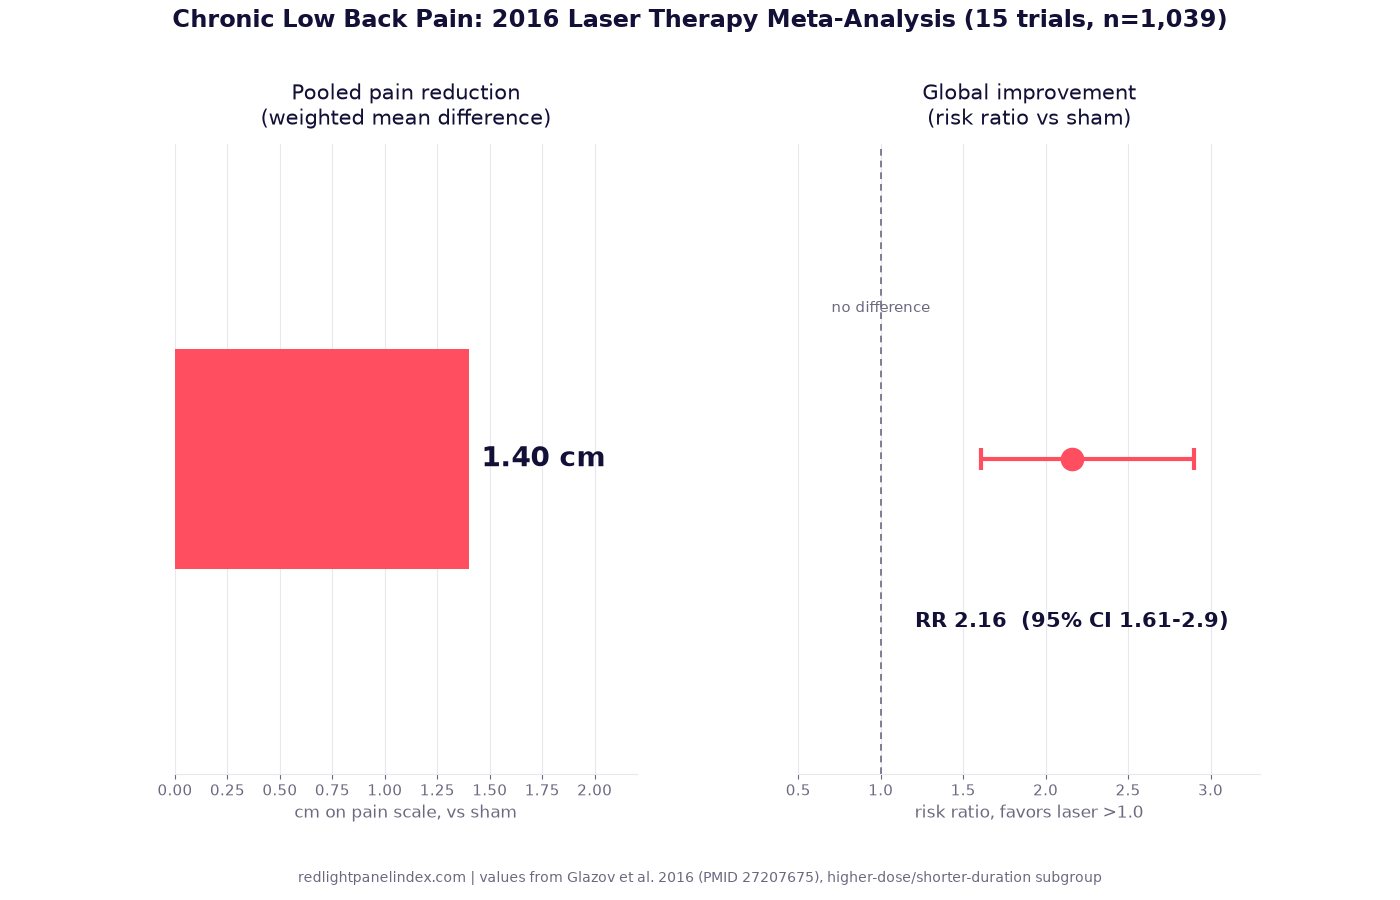
A 2016 meta-analysis pooled 15 trials and 1,039 patients on low-level laser for chronic back pain. What the dose and duration subgroups actually showed.
Red Light Therapy Results Timeline: What Trials Saw
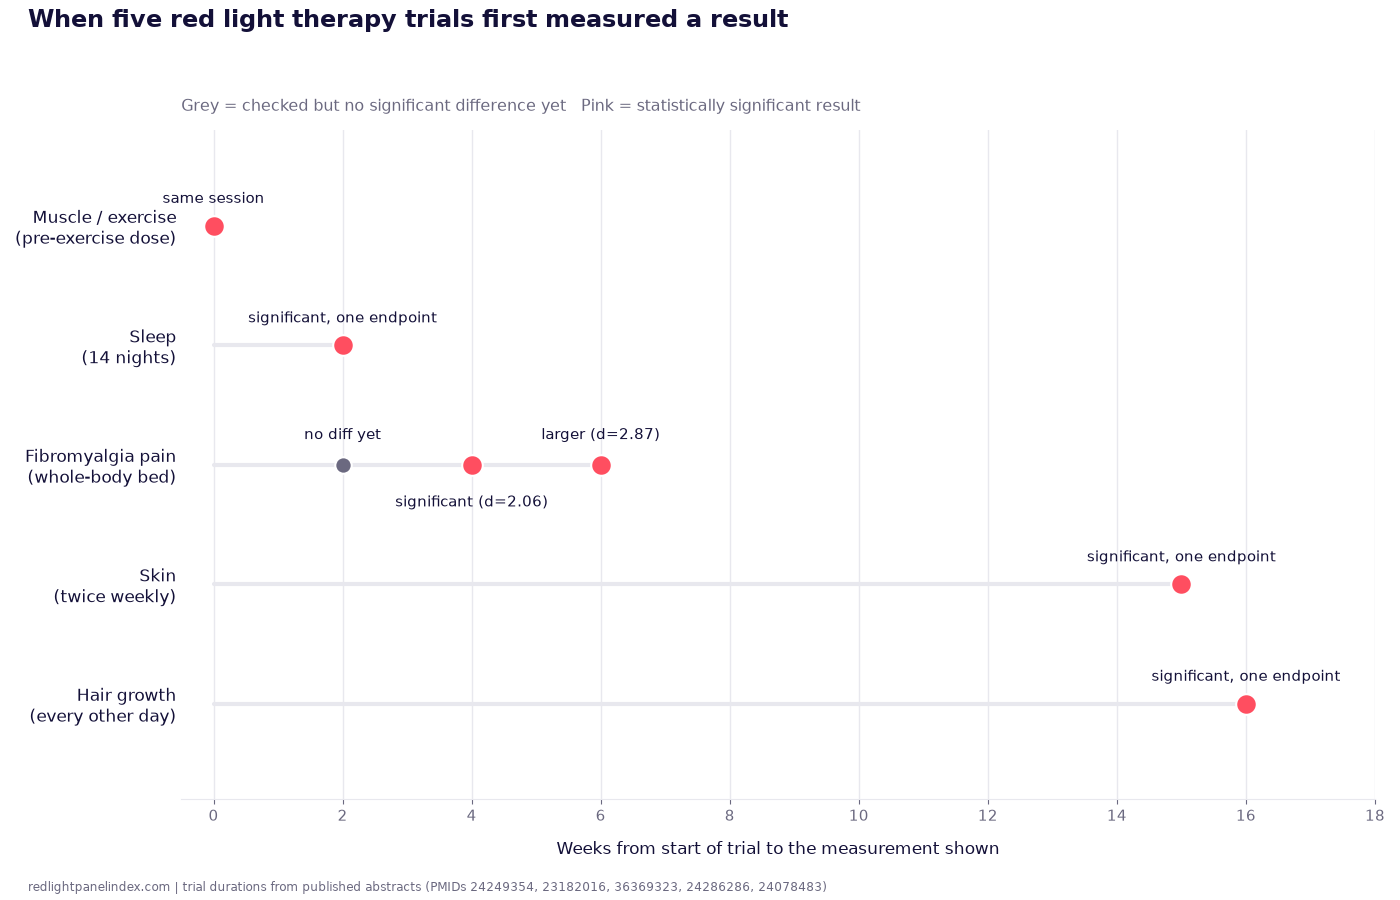
Skin, hair and pain trials checked at 15 to 16 weeks, not days. What the published studies actually measured, and when.
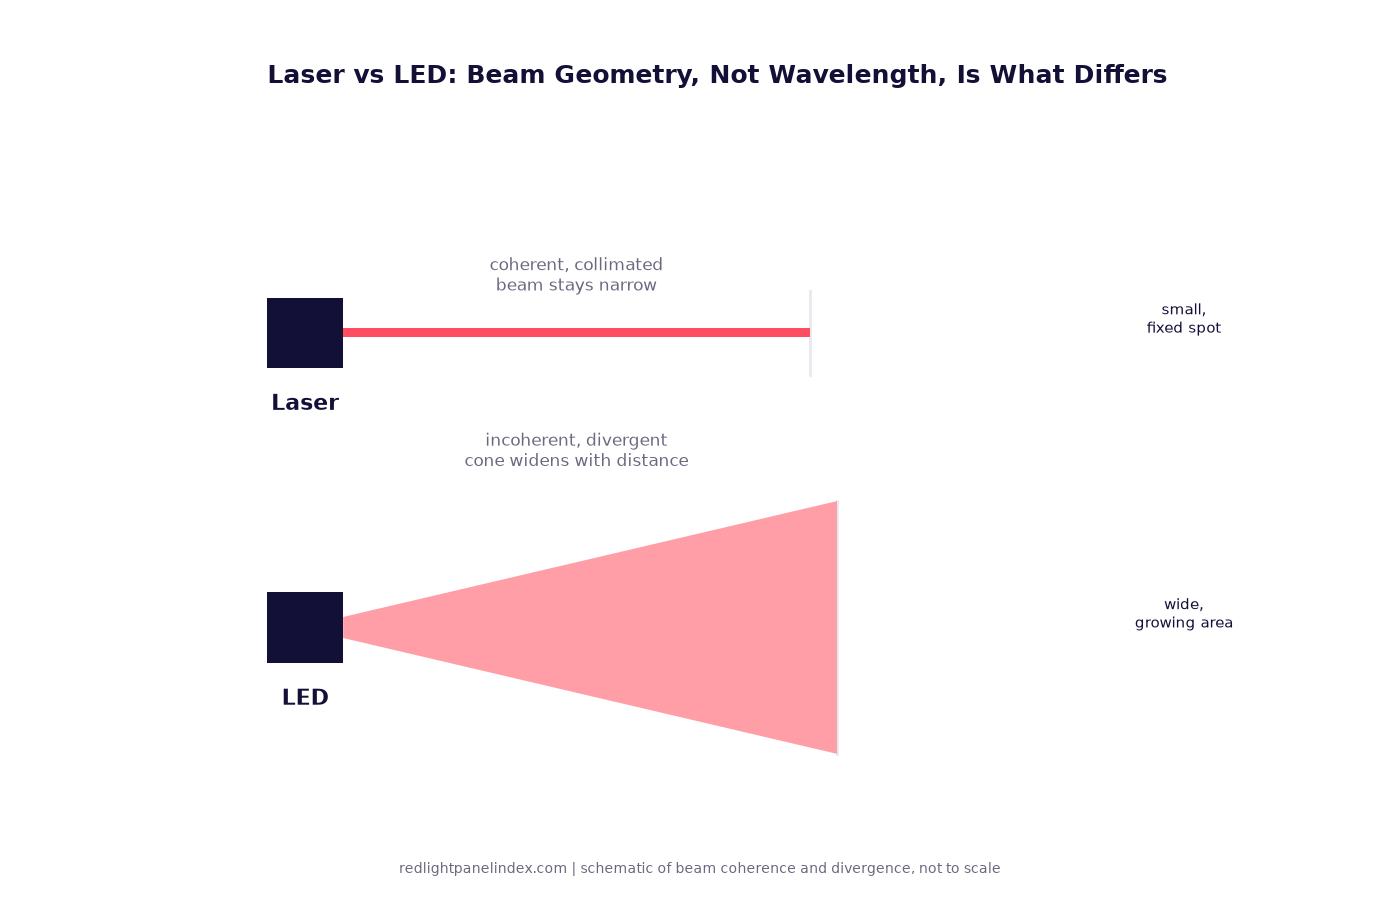
LED vs Laser for Red Light Therapy: Does Coherence Matter?
Most trial evidence started with lasers; most home devices use LEDs. What coherence is, and whether it changes tissue outcomes.
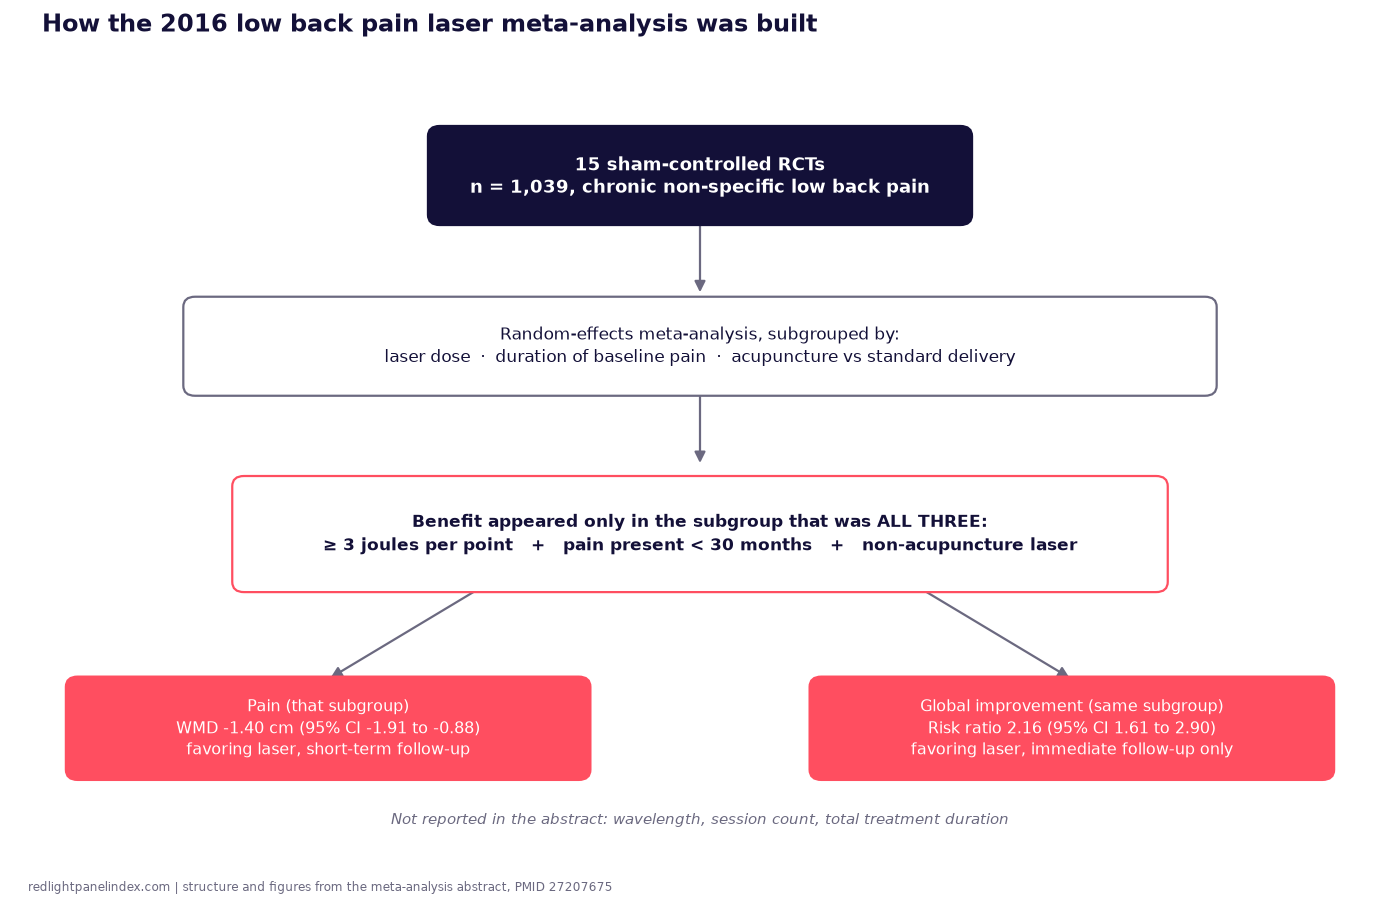
Red Light Therapy for Back Pain: What the Laser Trials Found
A 2016 meta-analysis of 15 trials found moderate-quality evidence for short-term back pain relief, but only above a laser dose threshold.
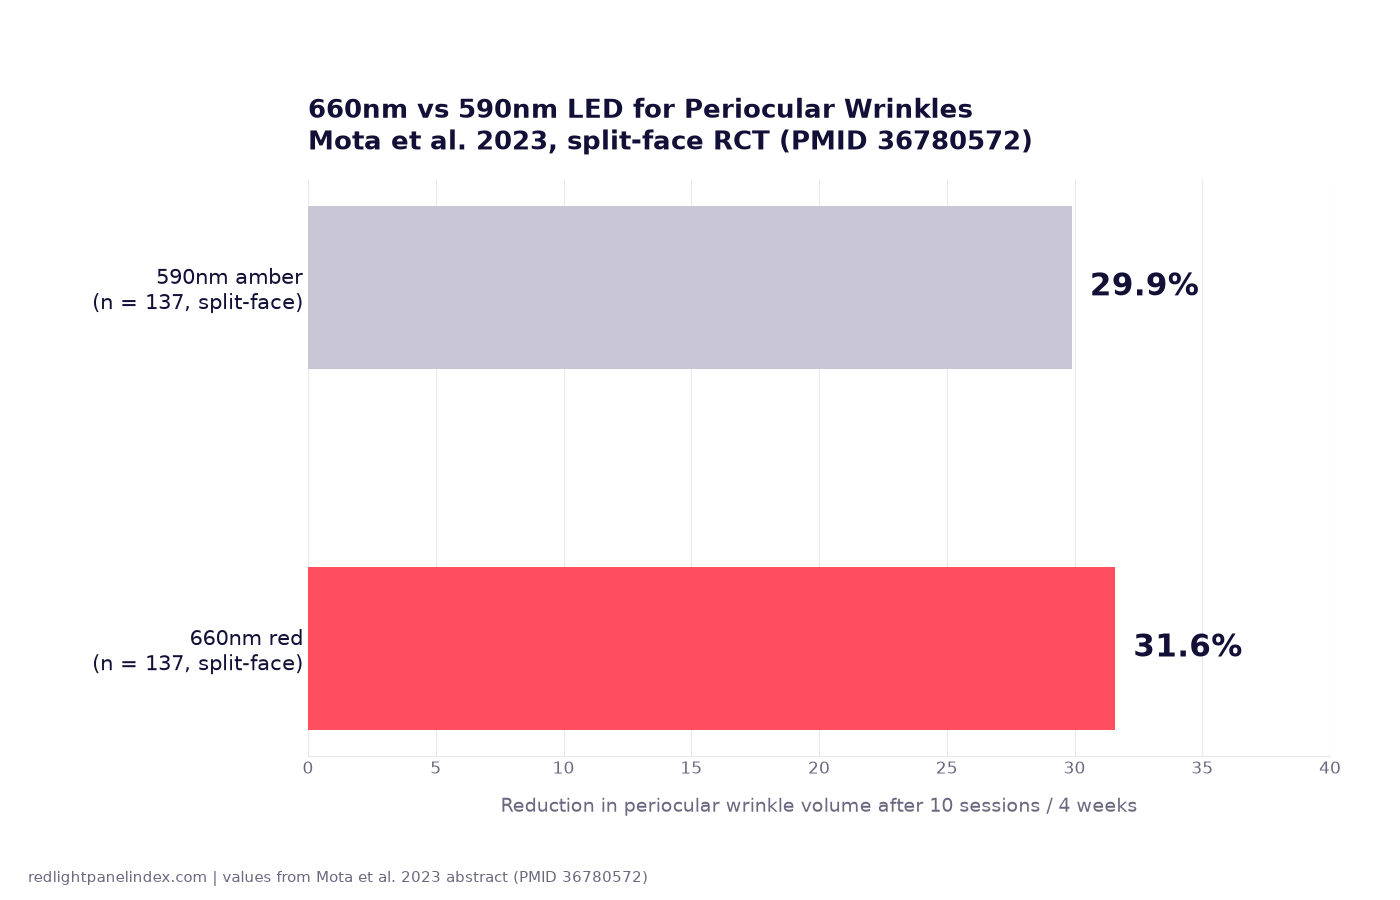
Study Review: 660nm LED for Periocular Wrinkles (2023)
A 137-woman split-face RCT compared 660nm red and 590nm amber LEDs at a matched 3.8 J/cm2 dose. What it found, and what it left out.
Best Red Light Panels for Skin and Anti-Aging
Panels ranked for facial and skin use on published 630-660nm plus 830nm density, method-labeled irradiance, and buyer terms.
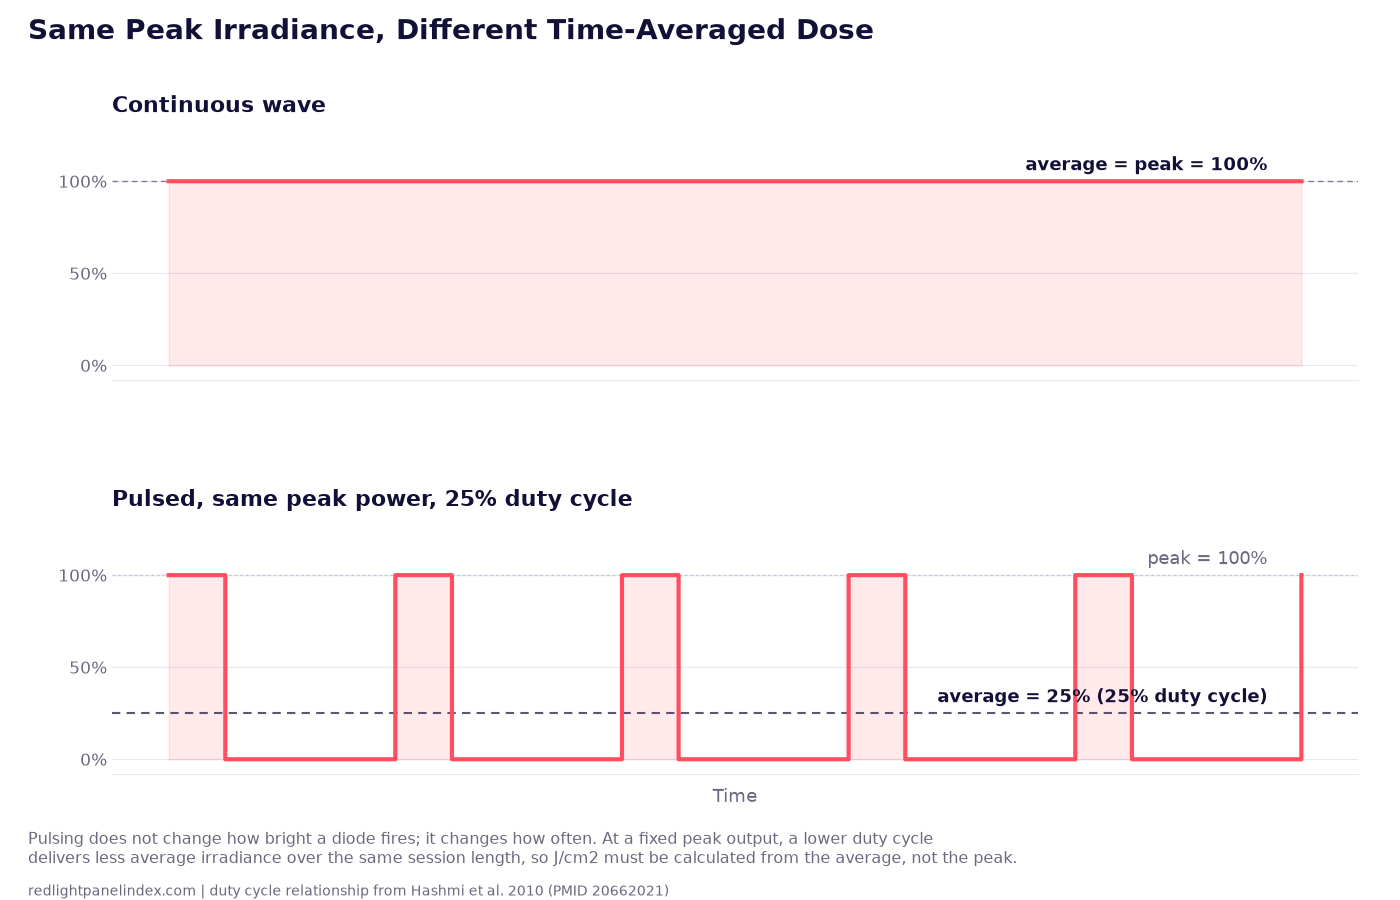
Pulsed vs Continuous Red Light: What the Evidence Says
A 2010 review of pulsing in low-level light therapy found mixed, condition-specific results and no general advantage over continuous light.
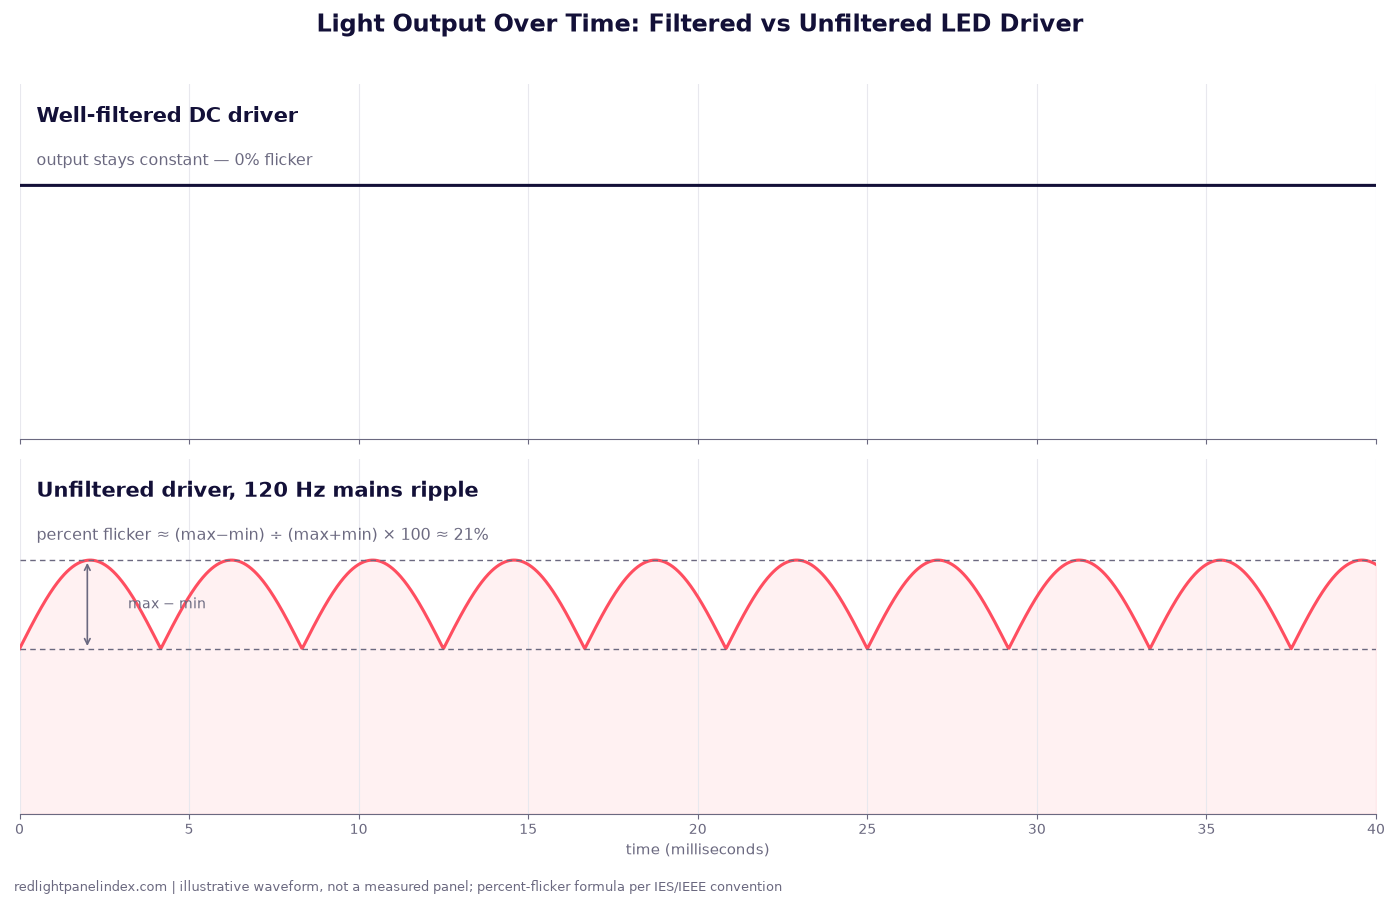
Flicker in LED Panels: What It Is and Whether It Matters
Percent flicker and flicker index explain the rapid brightness cycling a driver can leave in LED output, and why it is a comfort issue, not a therapeutic one.
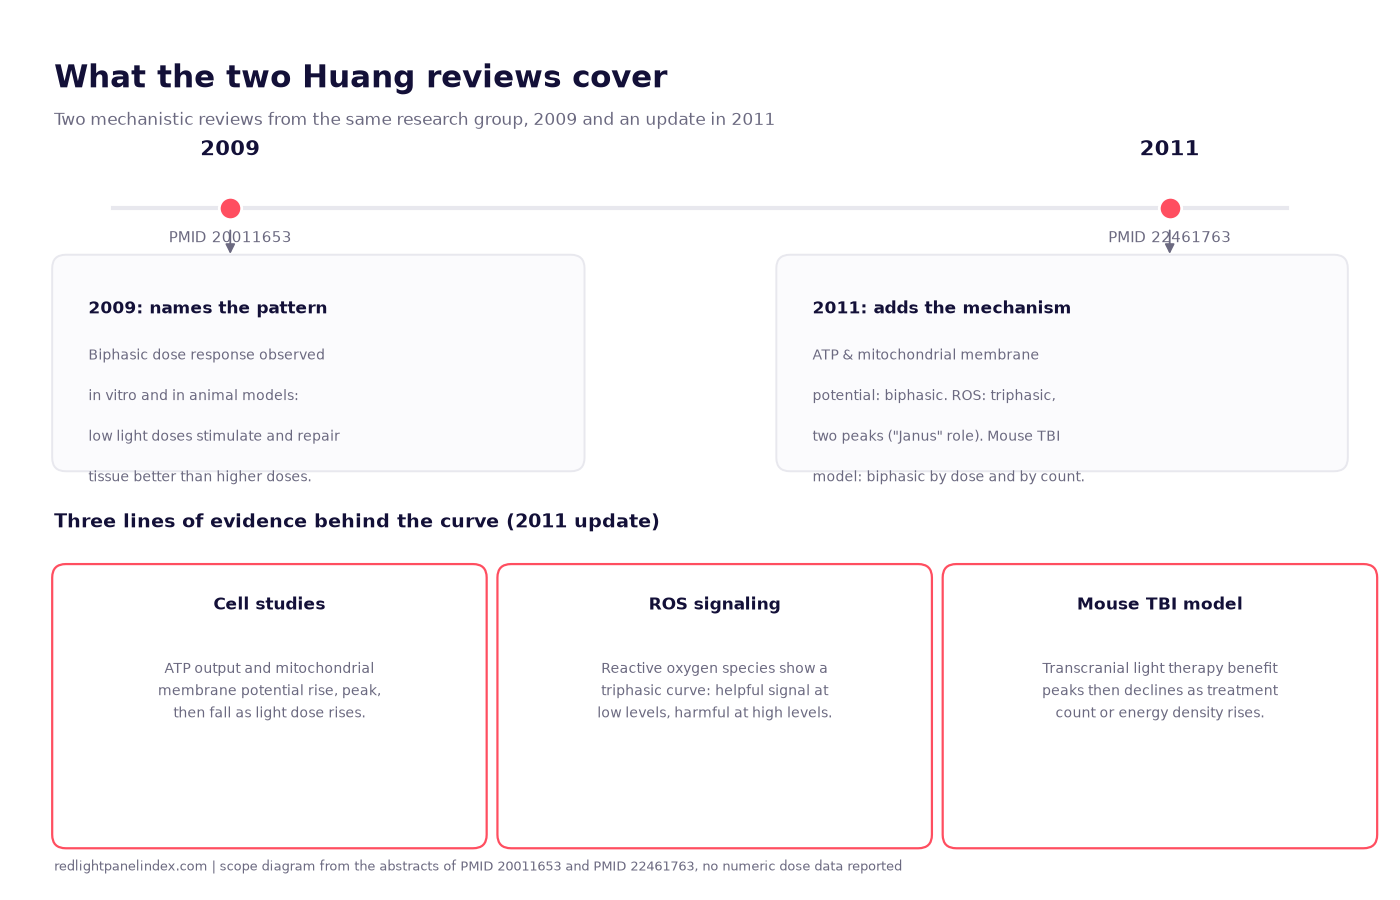
Study Review: The Biphasic Dose Response Papers
Two mechanistic reviews describe why more light does not mean a better result. What each paper covers, and what it leaves unanswered for a home panel.
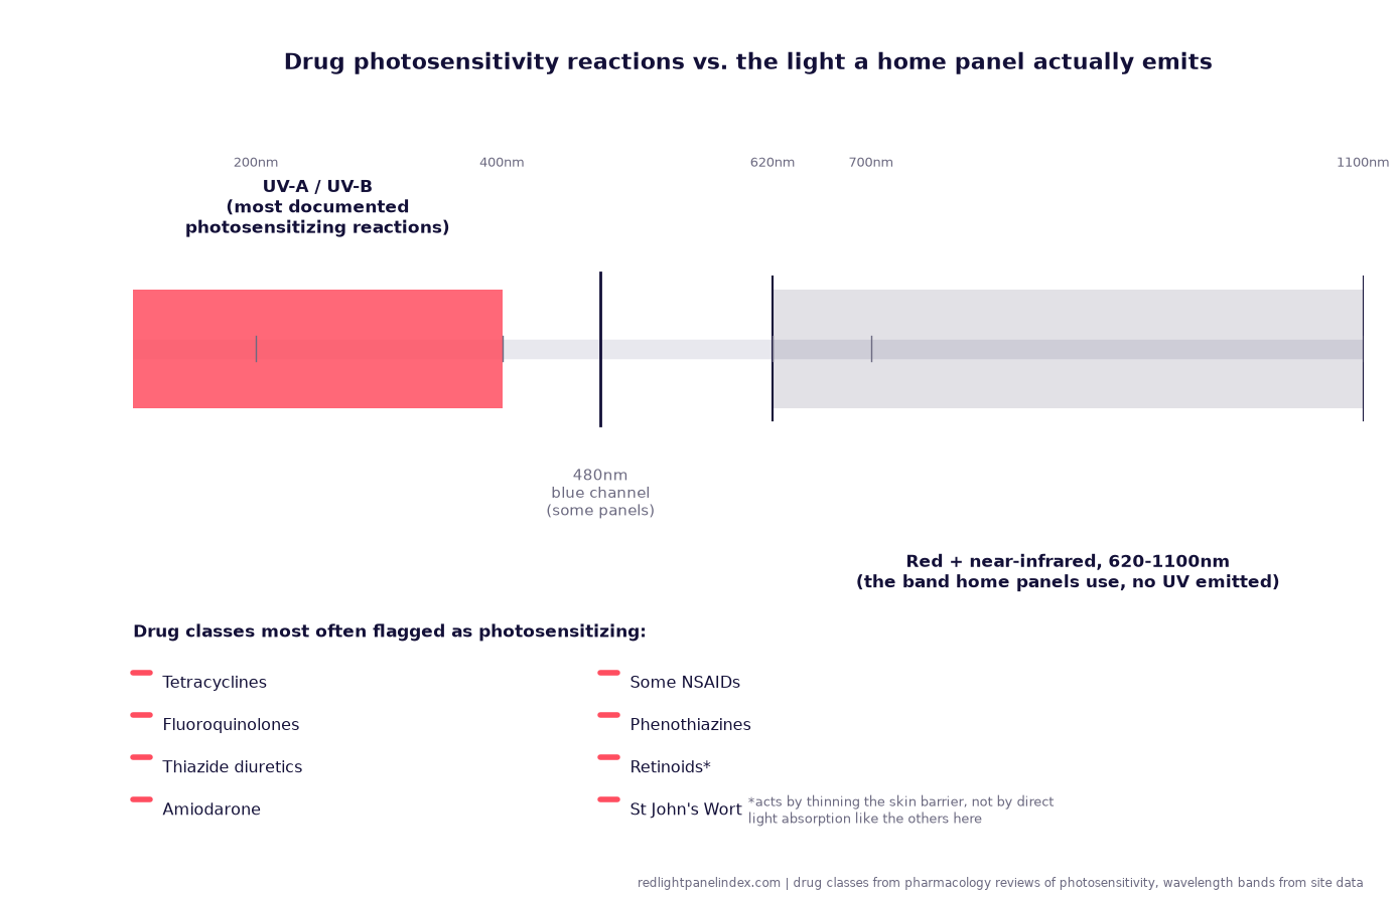
Red Light Therapy and Photosensitizing Medications
Drug classes flagged as photosensitizing, why most of that evidence is about UV light rather than red or near-infrared, and when to check with a prescriber first.