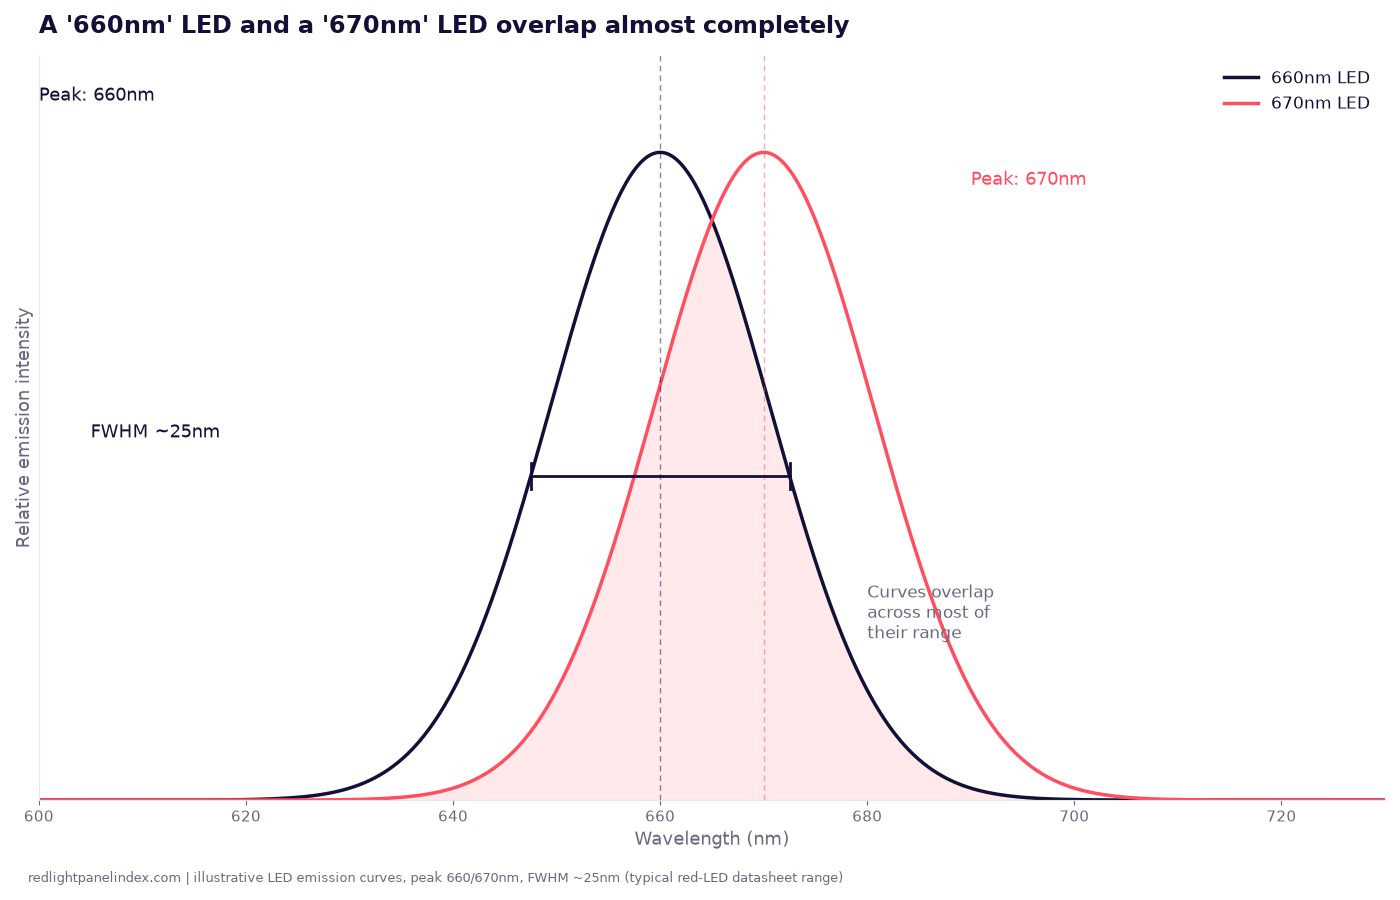
"660nm" on a spec sheet is a peak, not a single color coming out of the panel. Every LED emits a band of wavelengths centered on that peak, and the width of that band, called the full width at half maximum, or FWHM, determines how much a "660nm" panel and a "670nm" panel actually overlap.
Choosing a panel? Our ranking of the best red light therapy panels is computed from published, method-labeled specs across 188 devices. For reading a wavelength spec sheet, the number that matters is the published density at each band, not just the peak wavelength printed on the box.
What "peak wavelength" actually means
An LED does not switch on and emit one pure color the way a laser does. It emits a spread of wavelengths shaped roughly like a bell curve, and the peak wavelength is just the point on that curve where output is highest. A "660nm red LED" is a diode whose output curve peaks at 660 nanometers; on either side of that peak, the diode is still emitting meaningful light at 650nm, 655nm, 665nm and beyond, just at lower intensity.
This matters because two panels can print different peak numbers on their spec sheets while emitting almost the same light. A panel labeled 660nm and one labeled 670nm are not necessarily using different diodes tuned to different biological targets; they may be using LEDs from different bins of the same production run, with peaks that happen to land 10 nanometers apart.
Full width at half maximum, explained
FWHM is the width of the emission curve measured at half of its peak intensity: find the highest point on the curve, drop to half that height, and measure how wide the curve is at that height. A narrow FWHM means the LED's output is concentrated tightly around its peak. A wide FWHM means the diode is spreading real output across a broader range of wavelengths, even though the spec sheet still lists a single peak number.
Two LEDs with the same peak wavelength can behave differently depending on FWHM. A narrow-FWHM diode delivers more of its energy right at the labeled wavelength. A wide-FWHM diode delivers a meaningful fraction of its energy well away from that number, which is part of why a device's measured irradiance at a specific wavelength band can differ from what a simple peak-wavelength label implies.
Typical LED bandwidths
Manufacturer LED datasheets generally put the FWHM of a red diode, the kind used at 660nm, the single most common wavelength on this site's panel database, in the range of roughly 20 to 30 nanometers. Near-infrared diodes, the kind used at 810, 830 and 850nm, tend to run at the wider end of that range or slightly beyond it. These are general figures from LED engineering, not a claim about any single branded panel, but they set the scale for what "a wavelength" means in practice: not a line, a band roughly 20 to 30 nanometers wide.
Put a 660nm LED with a 25 nanometer FWHM next to a 670nm LED with a similar FWHM, and their emission curves overlap across most of their range, roughly from 655nm to 675nm. A reader comparing two panels on peak wavelength alone, one marketed as "660nm" and one as "670nm," is comparing numbers that describe two curves sitting almost on top of each other, not two distinct colors of light.
Why this shows up differently across panel designs
The practical version of this shows up in how panels are built. LED chip architecture affects how cleanly a panel's output concentrates around its stated peaks. Single-chip designs, used by brands including RLT Home, PlatinumLED and Hooga's HG line, put full diode power behind each stated wavelength, which the site's chip breakdown describes as producing "a cleaner spectral peak and stronger per-band output." Dual- and quad-chip designs, used by brands including Mito, Bestqool and Hooga's ULTRA line, split power across more wavelengths on the same panel for more even surface coverage, which spreads total output across a wider effective band even when each individual peak is labeled precisely.
Neither approach changes the underlying physics of FWHM. It changes how much total power sits behind each labeled peak, which is a separate question from how wide that peak's emission band is.
A worked example from the site's own wavelength data
The site's wavelength breakdown reports that panels can advertise seven wavelength labels while concentrating the large majority of real output in just two of them; it documents one premium panel putting roughly 80 percent of total LED power into its 660 and 850nm bands, with the other five labeled wavelengths contributing comparatively little. That same breakdown lists RLT Home's Total Spectrum line publishing a 14 percent power density at 1064nm, against roughly 19 percent for Helio Cure's panel at the same wavelength. Two panels can list an identical set of seven peak wavelengths on their box and still deliver meaningfully different doses at any one of them, because the peak list says nothing about how power is divided among the peaks or how wide each peak's band actually is.
That is the specific gap a peak-wavelength number cannot close by itself: it names a center point, not the width of the band around it and not the share of total output that band actually receives.
How to estimate overlap between two labels yourself
A rough rule follows directly from the numbers above: two LEDs overlap meaningfully whenever the gap between their peak wavelengths is smaller than their combined FWHM. Take a 660nm LED and a 670nm LED, each with a roughly 25 nanometer FWHM. The gap between the peaks is 10 nanometers. The half-width of each curve, half of 25, is about 12.5 nanometers, so each curve already extends past the other's peak before accounting for the tails. Their emission bands are not adjacent; they are stacked almost directly on top of each other across most of their range.
Compare that with a 660nm LED against an 850nm LED, a genuine red-versus-near-infrared comparison. The gap between peaks, 190 nanometers, is many times larger than either diode's FWHM, so the two bands barely touch. That is the kind of separation a wavelength label is actually useful for describing: it tells you almost nothing about the difference between "660nm" and "670nm," and almost everything about the difference between "660nm" and "850nm." Our 660nm vs 850nm comparison covers what that separation means for depth, trial evidence and how panels split power between the two bands.
Why spec sheets rarely publish FWHM directly
Most consumer panel listings print a single peak number per wavelength and stop there; FWHM is a diode-datasheet detail, not typically part of a marketing spec sheet, and independent spectrometer testing of finished panels is what usually surfaces it, if it surfaces at all. Our guide to reading irradiance labels covers the same instrument-and-distance questions worth asking about a wavelength claim as about an irradiance claim. That is one more reason a bare wavelength list, however many bands it names, is a weaker spec than a published density breakdown per band: density numbers are derived from the actual measured curve, FWHM included, while a peak label on its own reflects only where the diode's manufacturer chose to center its data sheet, not how wide the real output actually is around that point.
None of this means peak wavelength is meaningless. It is the right number for confirming a panel is targeting the right general region of the spectrum for the mechanism photobiomodulation research describes, red for surface-level work, near-infrared for deeper tissue. It is the wrong number for distinguishing between two panels whose labels sit close together, and it says nothing on its own about how much of a panel's total output actually lands at the wavelength printed on the box.
What this means for choosing a panel
A peak wavelength number is a starting point, not a full spec. Two panels a few nanometers apart on paper are very likely emitting overlapping light once FWHM is accounted for, so that gap alone is not a reason to prefer one over the other. What separates panels in practice is the published density at each band, which behaves like the input to the dose calculator: a wavelength you cannot find a density figure for is a wavelength you cannot verify you are actually receiving enough of, whatever the peak number on the label says. Pair the wavelength list with a method-labeled irradiance figure at the bands that matter for your use case, rather than treating the nanometer number by itself as the whole answer.