A spectrometer, or spectroradiometer when it is calibrated to report power, measures how much light a source emits at each wavelength rather than one lump-sum number for all of it. For a red light panel that matters because the panel's output is not one color: it is several narrow bands, and a spectrometer reports the power in each, which is why its irradiance figures are the ones this site treats as comparable between brands.
Choosing a panel? Our ranking of the best red light therapy panels is computed from published, method-labeled specs across 188 devices. For irradiance, the spec that matters is whether the figure names a spectrometer and the distance it was taken at.
How a spectrometer works
Inside a spectrometer, incoming light passes through a small opening and meets a diffraction grating or prism, which spreads it out by wavelength the way a prism spreads sunlight into a rainbow. A detector array behind the grating records how much power lands at each narrow slice of the spread. The instrument then reports power per wavelength, and adding up every slice gives the total.
That last step is the key difference from a solar power meter, which applies one fixed calibration factor to everything that hits its sensor. A spectrometer does not need to guess what kind of light it is looking at, because it measures the actual shape of the light. A published review of radiometry in the photobiomodulation literature recommends spectrometers coupled with optical fibers and either cosine correctors or integrating spheres, calibrated to a recognized standard, as an accurate measurement system (PMID 26964800).
What the chart shows
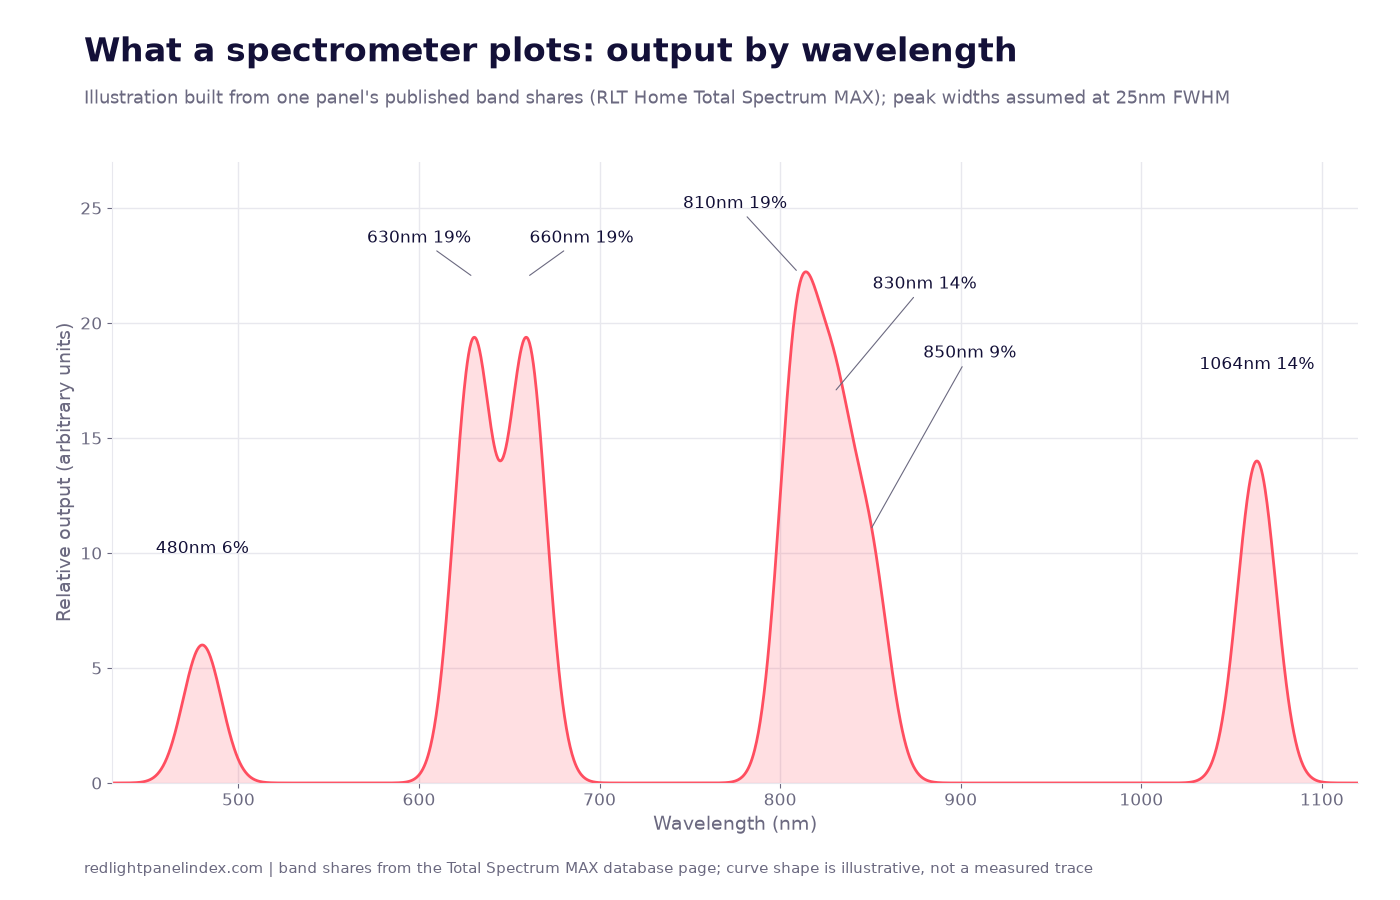
The standard output is a spectral power distribution: wavelength along the bottom, relative output up the side. Each band a panel emits shows up as a peak. Where the peak sits tells you the wavelength; how tall it is tells you how much power sits there; how wide it is tells you the bandwidth, which the site covers in its peak wavelength and FWHM explainer.
The chart at the top of this page is an illustration built from the published band shares of the RLT Home Total Spectrum MAX: 480nm at 6 percent, 630nm at 19 percent, 660nm at 19 percent, 810nm at 19 percent, 830nm at 14 percent, 850nm at 9 percent and 1064nm at 14 percent. The peak widths are assumed at 25 nanometers, within the roughly 20 to 30 nanometer range typical of LED datasheets, and the curve is not a measured trace from any instrument. It shows what a real trace of such a panel would look like: seven labeled bands that do not look like seven equal, separate lines. Peaks that sit close together, like 810, 830 and 850nm, merge into one broad hump.
Three things a spectrometer reading gives you
Total irradiance. Add up the power across all wavelengths and divide by the sensor area, and you have irradiance in milliwatts per square centimeter. That is the number the database lists, with its instrument and distance. The irradiance explainer covers how to read it.
Band shares. Because the instrument sees each wavelength separately, it can say how the total divides among the bands. When a brand publishes a percentage per wavelength, the spectrometer trace is where that kind of number can come from. A panel can list seven wavelengths and put most of its output in two of them, which a peak list alone would never reveal.
Peak position and width. The trace shows whether a "660nm" label really peaks at 660 and how wide the band is. A solar meter cannot tell you either one.
A worked example with real database figures
The Total Spectrum MAX page lists 100.53 mW/cm2 at 6 inches, measured by Electropossible Ltd with a named HP350IR spectrometer. The page notes the testing was commissioned by the brand, so it is a lab measurement, not a reading by an unaffiliated party.
If the published percentages describe each band's share of the optical output, the single total splits like this at 6 inches: about 19.1 mW/cm2 at 630nm, 19.1 at 660nm, 19.1 at 810nm, 14.1 at 830nm, 9.0 at 850nm, 14.1 at 1064nm and 6.0 at 480nm. The seven figures add back to the total. That is the practical payoff of a spectrometer: the 100.53 can be broken into the bands that matter for a given goal. Running that total for 10 minutes in the dose calculator gives about 60 J/cm2 across all bands combined.
Now compare two panels that publish both numbers. The RLT Home Total Spectrum ULTRA lists 174 mW/cm2 on a solar meter and 119.28 mW/cm2 on a spectrometer, a ratio of 1.46. The BlockBlueLight PowerPanel MID lists 158 mW/cm2 on a solar meter and 61 mW/cm2 on a spectrometer. The solar-meter figure runs about 1.46 times the spectrometer figure on the first panel and about 2.6 times on the second, so no one conversion factor turns a solar-meter number into a spectrometer one. The site's claimed versus measured study puts the median gap across 44 panels at 2.18 times, with a range from 1.36 to 2.60.
Why it is the reference method
The reasoning is simple. A spectrometer measures what is actually there, wavelength by wavelength, so its answer does not depend on how closely a panel's spectrum resembles the one the instrument was calibrated for. A broadband sensor's answer does. That is why this site's rankings use the spectrometer figure, and why a figure with no stated method is shown as "method not stated" instead of being given credit.
What a spectrometer reading does not settle
A spectrometer figure is still a figure at one spot and one distance. A few cautions follow.
- Where the probe sat. A panel's output is not uniform across its face. A center reading and a panel-wide average can differ, and the site lists them separately when a tester reports both, as in the peak and average pair for the PlatinumLED BioMax 900. The radiometry review above also warns that measurements can overstate irradiance when the beam is larger than the probe, so how the sensor was positioned matters (PMID 26964800).
- Distance. A flat panel is not a point source, so a 6-inch reading cannot simply be rescaled; the inverse square law explainer shows why.
- Who measured. A brand's in-house spectrometer test and an outside tester's test are both spectrometer figures, but they are not equally independent. The database labels which is which.
- Size. Irradiance describes one spot, not total output, which is the subject of the irradiance versus total power page.
The same review found that, in a sample of 74 photobiomodulation papers, 73 percent gave no information on how light was measured and relied on manufacturer-stated values (PMID 26964800). That is the research-side version of the problem on spec sheets: a number without a method is hard to trust.
How to read a brand's test report
When a brand publishes a spectrometer report, check these in order:
- The instrument is named. A model name, not just the word "spectrometer."
- The distance is stated. A figure with no distance cannot be compared.
- Peak or average is stated. A peak reading and an area average are different numbers.
- Who ran the test. In-house, commissioned lab, or outside tester.
- The trace or band table is shown. A report that gives a single total and no band breakdown tells you less than one that shows the curve.
The guide to reading irradiance labels walks through the same three labels the database uses, and the high-irradiance panel ranking applies them to the models with the strongest method-labeled readings. To compare a claim with a handheld meter at home, see how to check a panel's irradiance claim yourself.
Bottom line
A spectrometer is the instrument that sees a panel's light as it actually is: several bands, each with its own power and width. That is what makes its irradiance figure comparable across brands, and what lets a total be split into the bands that matter. It does not remove the need to ask where, at what distance and by whom the reading was taken.