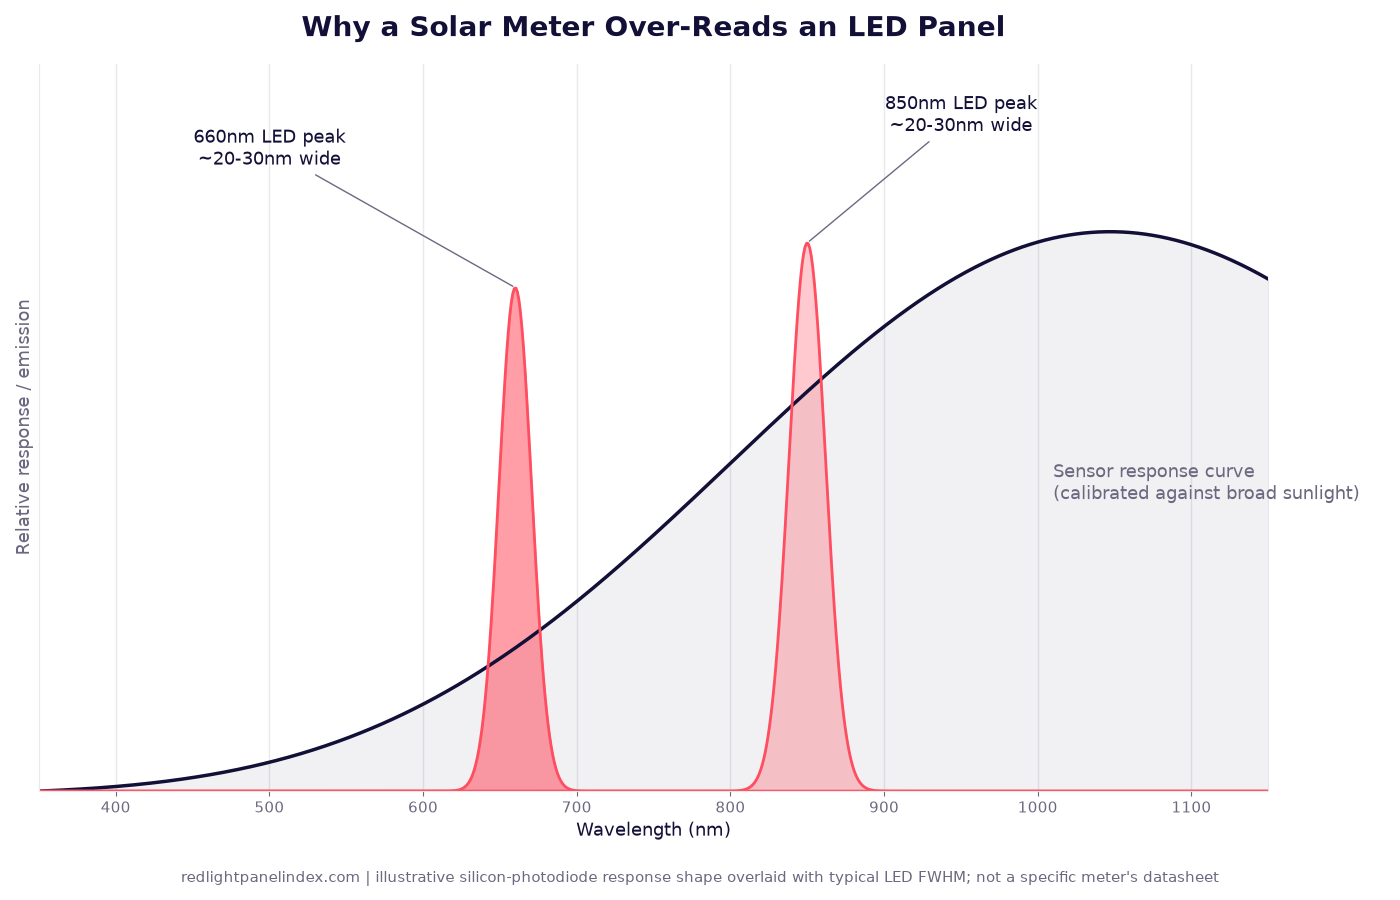
A solar power meter is a handheld light sensor built to measure sunlight, and the number it prints for a red light panel is not the panel's true optical output; it is a broadband instrument's best guess at a narrowband source, and that guess runs high. The gap is not random error. It is a predictable, repeatable overshoot that comes from how the sensor inside the meter is calibrated, and once you understand that calibration you can read a solar-meter figure for what it actually tells you.
Choosing a panel? Our ranking of the best red light therapy panels is computed from published, method-labeled specs across 188 devices. For irradiance claims, the spec that matters is whether the figure came from a spectrometer, not a solar meter.
What is inside the meter
A solar power meter is built around a silicon photodiode, the same basic sensor type used in solar-installer tools and handheld light meters. Silicon photodiodes are not equally sensitive to every wavelength of light; their responsivity rises through the visible range and keeps climbing into the near-infrared, typically peaking somewhere around 900 to 1,000 nanometers before falling off past about 1,100 nanometers. That curve is not flat, and the meter's electronics have to correct for it before they can print a single number in milliwatts per square centimeter.
The correction is a calibration factor, and it is calculated against the sun. The sun's spectrum is broad and continuous, spreading power across ultraviolet, visible and infrared wavelengths in a smooth, well-characterized curve (the reference solar spectrum used for this kind of calibration is often called AM1.5). A solar meter's calibration factor is tuned so that, when the sensor's naturally uneven response is averaged across that whole broad spectrum, the meter reads out an accurate total for sunlight. That single factor is baked into the meter; it does not change based on what kind of light is actually hitting the sensor.
Why that breaks on an LED panel
A red or near-infrared LED panel does not emit a broad, sun-like spectrum. It emits narrow, concentrated bands centered on specific wavelengths, commonly around 660 nanometers and 850 nanometers, each only about 20 to 30 nanometers wide at full width, half maximum. Point a solar meter's silicon photodiode at one of those narrow bands and the sensor responds according to its own uneven curve at that specific wavelength, not the flat average the sun-based calibration assumes. Because red and near-infrared LED peaks tend to sit on a part of the silicon photodiode's response curve that is more sensitive than the broadband average the meter was calibrated against, the meter's fixed conversion factor overstates the light's actual radiant power. The result is a number that looks like a legitimate irradiance reading in milliwatts per square centimeter, measured with a real instrument, but that instrument was never calibrated for the light it is being pointed at.
This is a documented, general problem with broadband silicon sensors used outside their intended spectrum, not a defect unique to any one meter or brand: any silicon photodiode built for a broad reference spectrum will over- or under-read a narrowband source depending on where that source's wavelength falls relative to the sensor's own response curve and the calibration assumption baked in at the factory. A spectrometer sidesteps the problem entirely because it does not use one fixed conversion factor at all. It disperses incoming light by wavelength with a diffraction grating or prism, measures the power actually present at each narrow wavelength band, and integrates across the real, measured spectrum of whatever light source is in front of it. A spectrometer reading a 660-nanometer LED and a spectrometer reading sunlight are both reporting what is actually there, wavelength by wavelength, rather than applying a single correction built for one specific spectral shape.
What this looks like across real panels
Our irradiance methodology page tracks 44 panels with both a solar-meter figure and an independent spectrometer figure for the same device at the same distance, and the pattern holds across the whole set: the solar-meter number averages 2.11 times the spectrometer number, with a median of 2.18 and a range from 1.36 to 2.60 depending on the panel's specific mix of wavelengths and the meter used. A few examples show the spread. The BlockBlueLight PowerPanel MAX posts 162 mW/cm2 on a solar meter against 82 mW/cm2 on a spectrometer, a 1.98x ratio. The Rojo Refine 3600 runs wider, 195 mW/cm2 on a solar meter against 75 mW/cm2 on a spectrometer, a 2.60x ratio. The RLT Home Total Spectrum ULTRA sits at the narrow end, 174 mW/cm2 on a solar meter against 119.28 mW/cm2 on a spectrometer, a 1.46x ratio. No single conversion factor recovers the true figure from a solar-meter number alone, because the ratio moves with the panel's exact wavelength mix and LED bandwidth, not just its power.
Why brands use them anyway
A solar power meter costs somewhere in the neighborhood of thirty to a few hundred dollars and fits in a pocket. A calibrated spectrometer capable of resolving narrow LED peaks costs thousands of dollars, needs periodic recalibration, and is slower to use for a quick reading. Solar meters were built and sold in volume for an entirely different job, checking photovoltaic panel output and daylight levels, which means they are cheap, widely available and easy for a brand's marketing team to use for a fast number on a spec sheet. Using one is not inherently dishonest; plenty of brands that publish a solar-meter figure are simply using the tool that was on hand. The problem is only that the number, taken alone, is not comparable to a spectrometer figure from a different brand, and it is not a reliable estimate of the light actually reaching skin.
How to read a solar-meter-only figure
Treat a solar-meter number with no spectrometer figure alongside it as a ceiling, not a measurement you can act on. Do not attempt to divide it by 2 or any other single factor to back out a "real" number; the 44-panel range runs from 1.36x to 2.60x, so a fixed correction would be wrong for most individual panels even though it is close on average. The more useful question is whether the brand also discloses a spectrometer reading, or discloses which instrument produced the number at all. Our irradiance page lays out the three things a trustworthy spec needs: the instrument, the distance, and whether the figure is peak or average. A number with none of those three is effectively unverifiable, whatever the meter used to produce it.
What to compare instead
When two panels both publish spectrometer-verified figures at the same distance, that comparison is meaningful; when one publishes a solar-meter number and the other a spectrometer number, they are not on the same scale and should not be compared directly. Distance matters too, and not in the simple way you might expect: because a panel is a flat, extended light source rather than a single point, its output falls off with distance more gradually at close range than the inverse square law predicts, so a 6-inch figure cannot be rescaled by hand to estimate a 12-inch or 24-inch distance. And a high irradiance number by itself does not tell you how much of your body a panel can treat at once; a small panel can post a higher center-point reading than a large one while covering far less area, which is the separate question our irradiance vs total power page addresses. Method-labeled, same-distance, same-instrument figures are the only figures worth lining up side by side.