You can check a panel's irradiance claim with a handheld solar power meter, but only if you compare the result with the right figure: a consumer meter is the same kind of instrument many brands use for their headline number, so it will read close to a solar-meter claim and roughly double a spectrometer figure. The method below gives a repeatable reading; the interpretation section tells you what it proves and what it does not.
Choosing a panel? Our ranking of the best red light therapy panels is computed from published, method-labeled specs across 188 devices. For checking a claim yourself, the spec that matters is the instrument and distance the brand states next to its figure.
What a consumer meter can and cannot do
A handheld solar power meter is built around a broadband silicon sensor calibrated for sunlight. The solar power meter explainer covers why that matters: on narrow LED bands it overstates the true optical output in a fairly predictable direction. So a home meter is useful for three things:
- Checking a solar-meter claim. If a brand states its figure came from a solar meter, your reading should land in the same neighborhood.
- Comparing two sessions or two distances on your own panel. The meter's bias is the same each time, so relative changes are meaningful.
- Spotting a panel that reads far below its stated figure at the stated distance.
It cannot give you a true spectrometer-grade figure, and it cannot tell you how the output divides among wavelengths. For that you need the instrument covered in the spectrometer explainer. A published review of radiometry in this field also notes that photodiode power meters have a spectral sensitivity that differs with wavelength, so they can under- or over-estimate a broadband source (PMID 26964800).
What result to expect
The site's claimed versus measured study compares brand claims with spectrometer readings for 44 panels. The claim averages 2.11 times the spectrometer figure, with a median of 2.18 and a range from 1.36 to 2.60. Thirty-eight of the 44 claims are solar-meter figures. Read that against your own meter:
- If the brand's claim is a solar-meter figure, expect your reading to be near it, not near the spectrometer number.
- If the brand publishes both, as the BlockBlueLight PowerPanel MID does with 158 mW/cm2 on a solar meter and 61 mW/cm2 on a spectrometer, both at 6 inches, your solar meter reading should be compared with the 158, and the 61 is the working value for dosing.
- If the brand's claim has no stated method, your reading tells you roughly where it sits, but it cannot confirm it. The guide to reading irradiance labels explains why.
How to run a repeatable measurement
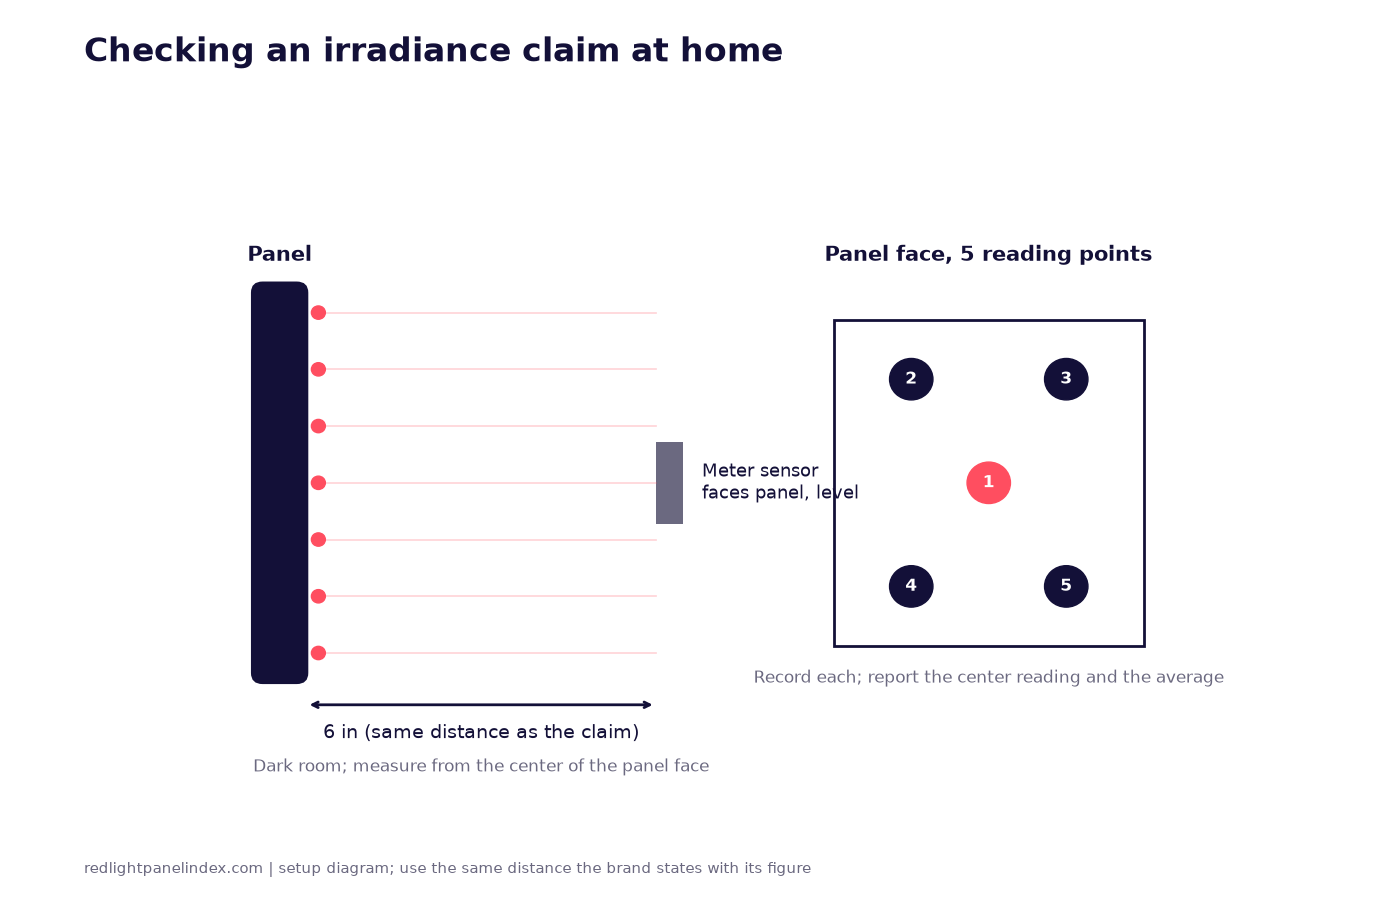
The diagram above shows the setup. The steps:
- Find the claim's distance. Use the distance the brand states with its figure, usually 6 inches in the database. A reading at a different distance is not comparable, and the drop with distance is not a simple straight line for a flat panel (see the inverse square law explainer).
- Darken the room. Ambient light, especially sunlight through a window, adds to the reading. Measure with other lights off and the blinds closed.
- Fix the meter in place. Use a ruler or a stack of books so the sensor sits at the stated distance from the panel face, level and facing the panel head-on. Hand-holding changes the distance by a small amount that matters at close range.
- Let the panel run. Turn it on and note whether the reading changes during the first minutes. Record the value once it settles, and say which you recorded.
- Take five readings. Measure at the center of the panel face and at four points toward the corners, as in the grid in the diagram. Note each reading.
- Report two numbers. The center reading and the average of the five. Brands that publish both a peak and an average, like several entries in the high-irradiance panel ranking, are describing the same thing.
- Repeat once. Run the whole sequence a second time on another day. If the two center readings differ a lot, something in the setup is moving.
Keep your eyes away from the panel while you work: you will be close to its face with it switched on, so follow the eye protection guide.
How to read the result
Divide your center reading by the brand's stated figure, being careful which one you divide by.
- Within the same neighborhood as a solar-meter claim. The claim is plausible for that instrument. It does not tell you the spectrometer figure, which is the one that matters for dosing.
- Well below the claim. Re-check distance and alignment first. If it still reads well below at the stated distance, the claim may be a peak figure, a different distance, or a brand-tested number that does not match what you were sent. Ask the brand.
- Above the claim. Not a cause for concern by itself, because the meter's bias runs high on LED light.
Do not divide your reading by 2 and call the result a spectrometer figure. The study's range of 1.36 to 2.60 means a fixed factor will be wrong for most individual panels. The site's working rule for dosing is to treat roughly half of a solar-meter or unlabeled figure as the value to use.
From reading to dose
The reason to care is the dose. Take the PowerPanel MID example. Entering 158 mW/cm2 and a 10 minute session into the dose calculator gives 94.8 J/cm2. Entering the spectrometer figure of 61 gives 36.6 J/cm2. Only the second describes the light reaching the skin, so a session plan built on a solar-meter number can overstate the dose by more than double. The dosing explainer covers how to choose a target.
Keeping a record
Write down the date, the meter model, the distance, the room conditions and all five readings. A record like this lets you compare the same panel months later and see whether its output has changed, and it makes any conversation with a brand specific: you can say what you measured, where and how, rather than that the panel feels weak. Keep the same meter and the same setup each time so that differences in the numbers reflect the panel and not the method.
Pitfalls
- Sensor range. Check the meter's stated spectral range and what it was designed for. A meter built for sunlight is the common case; it is not a spectrometer.
- Unstable readings. If the number jumps around, hold the meter still and read it several times. A flicker in the source can make a display look unsteady.
- Panel size. A high reading at one spot does not mean strong output across the whole panel. See irradiance versus total power.
- Not a certification. A home reading is a sanity check, not a lab test, and it should never be reported as a spectrometer figure.
What this means for buying
Before you buy, you cannot run this test, so use the database labels instead: a figure that names its instrument and distance is worth more than one that does not. After you buy, a quick home measurement against the stated claim tells you whether the panel behaves as described (a measurement of light, unlike the wattage in a model name, which the optical versus electrical power page explains), and the written record helps if you need to raise it under the brand's warranty or trial terms. A review of 74 photobiomodulation papers found that most gave no information on how light was measured and relied on manufacturer-stated values (PMID 26964800); a home check closes that gap for a single device.