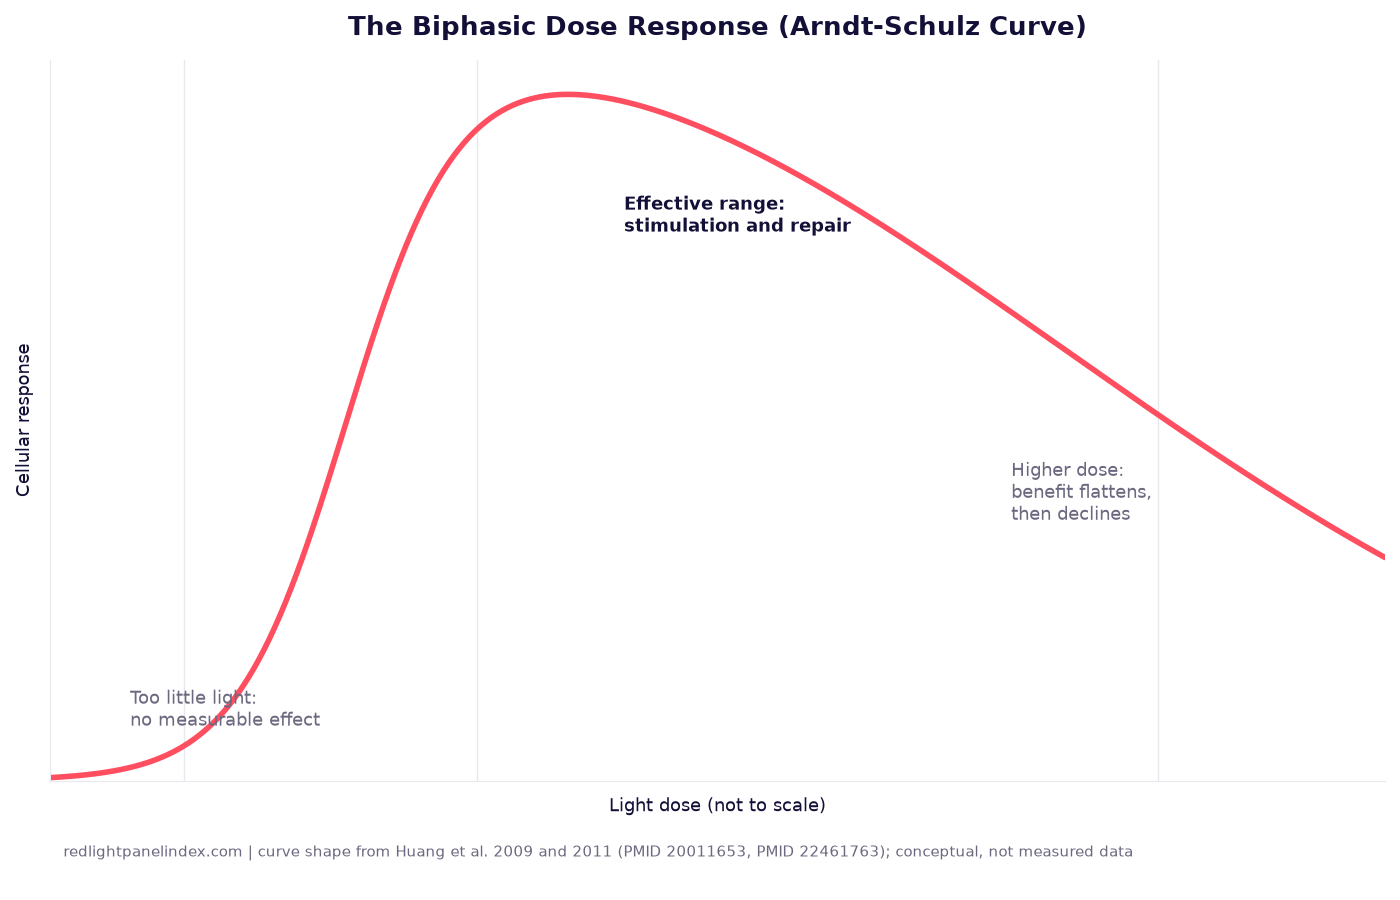
The biphasic dose response is the finding that a low dose of red or near-infrared light stimulates and repairs cells, while a high enough dose stops helping or works against the same effect. It is described by two mechanistic reviews from the same Wellman Center for Photomedicine research group, one from 2009 and an update from 2011, and it is usually called the Arndt-Schulz curve after the older pharmacology principle it resembles (PMID 20011653, PMID 22461763); a dedicated study review of both papers covers what each one actually studied and what it left unanswered. It does not hand down one universal joule figure that applies to every wavelength, tissue and device; it is a caution against assuming a longer session always beats a shorter one once a session is already delivering a dose shown to work.
Choosing a panel? Our ranking of the best red light therapy panels is computed from published, method-labeled specs across 188 devices. For staying inside a sensible dose range, the spec that matters is a method-labeled irradiance figure, since that is the number any session-length calculation runs on.
What "biphasic" means here
A dose-response curve plots how strong an effect is against how much of something produced it. A biphasic curve rises, peaks, and then falls, rather than climbing in a straight line forever. Applied to light therapy, the 2009 review states it directly: "a biphasic dose response has been frequently observed where low levels of light have a much better effect on stimulating and repairing tissues than higher levels of light" (PMID 20011653). Too little light does not do enough to trigger a measurable response; a middle range produces the stimulating effect; and a high enough dose either stops adding benefit or actively works against it. This site's J/cm2 explainer already touches this idea through a separate 2012 review that frames it as the reason trials report dose in a standard unit at all, rather than just naming a wavelength or a session length.
Where the name comes from
The Arndt-Schulz label predates light therapy by more than a century; it comes from a general 19th-century pharmacology observation that weak stimuli of many kinds can increase biological activity, moderate stimuli increase it further, and strong stimuli suppress or halt it. Photobiomodulation researchers borrowed the name because the shape of the curve they measured in light-treated cells matched that older pattern closely enough to be useful shorthand, not because red light therapy behaves identically to a drug dose-response curve in every respect. The Huang reviews use the term in that borrowed sense: as a description of the curve's shape, not as a claim that light and pharmaceuticals share the same underlying mechanism.
The mechanism, from cell studies
The 2011 update goes further into why this happens at the cellular level. In vitro, markers like adenosine triphosphate (ATP) production and mitochondrial membrane potential both show a biphasic pattern as light dose increases, while mitochondrial reactive oxygen species (ROS) show something more complex: a triphasic pattern with two separate peaks rather than one (PMID 22461763). The review describes ROS as having a "Janus nature," meaning the same molecule can act as a helpful signaling messenger at low concentrations and a harmful, cell-damaging agent at high concentrations. That dual role is the review's proposed explanation for why a cell's response depends on how much light reaches it and not simply on whether light reaches it at all: a small rise in ROS can nudge a cell toward normal signaling and repair, while a much larger rise pushes the same pathway toward oxidative stress instead.
Evidence from an animal model
The clearest whole-organism example the 2011 review cites is transcranial low-level light therapy for traumatic brain injury in mice. It reports "a distinct biphasic pattern with peaks in beneficial neurological effects observed when the number of treatments is varied, and when the energy density of an individual treatment is varied" (PMID 22461763). In plain terms: past a certain number of treatment sessions, or past a certain per-session energy density, the neurological benefit in these mice stopped improving and started to decline, in two separate variables measured independently. Neither the 2009 nor the 2011 review states the specific dose or session count where that peak occurred in numeric terms usable outside their own mouse model, and neither translates it into a J/cm2 figure for a human scalp or a home panel. The finding that matters for a reader here is the shape of the curve, not a transferable number: increasing either how often or how strongly a tissue was treated eventually stopped helping and then reversed, in a controlled animal study designed specifically to look for that pattern.
Why there is no single ceiling number
Neither review sets one dose above which red light therapy "reverses" its own benefit for every wavelength, tissue and device. The threshold in their in vitro and animal data shifts with wavelength, with the tissue type studied, and with how the outcome was measured. This site's J/cm2 page covers a separate 2018 parameters review that found tissues with more mitochondria per cell, including muscle, brain, heart and nerve, tended to respond to lower doses than tissues with fewer mitochondria, such as skin, tendon and cartilage, and that ineffective results in the high-mitochondria tissues were more often explained by over-dosing than under-dosing (PMID 30550048). Put together with the biphasic mechanism above, that is a reason a joint or muscle target may tolerate less added dose before the curve turns over than a skin target does, even though neither review names an exact cutoff for either tissue.
What this means for a home session
The practical translation is simple even without a universal number: hit the dose a published trial actually used, and stop, rather than assuming that sitting longer under the panel can only help. This site's session length guide walks through the arithmetic, target dose divided by your panel's measured irradiance, and the dose calculator runs that formula directly so a session can be set to a specific J/cm2 figure instead of a round number of minutes chosen out of habit. The same caution applies to how often you go back, not just how long each session runs; this site's guide to session frequency already states the same principle directly and reports that two properly dosed sessions a week beat seven overdosed ones in the trials it reviews, which is the biphasic idea applied to frequency rather than to a single sitting.
What is not established
Neither Huang review sets a specific joules-per-square-centimeter ceiling for a consumer red or near-infrared panel used at home, and no trial cited on this site has been designed to test where that ceiling sits for a given wavelength and target tissue outside a laboratory. The 2011 review itself ends by calling for "further understanding of the extent to which biphasic dose responses apply in LLLT" before clinical treatments can be fully optimized around it, which is an acknowledgment from the researchers who described the curve that the exact numbers are still being worked out even for controlled conditions. That leaves the trial-tested dose figures already published, not an assumed higher one, as the only defensible target for a home session: the dosing guide lists the specific doses used across the trials this site cites, and none of them is a reason to add extra minutes on the theory that more light can only help.
None of this is a safety warning in the sense of tissue damage from a home panel; the reviews describe a curve where the effect stops improving or reverses, not a hazard comparable to the thermal or eye-safety cautions this site's safety and side effects page covers separately. The practical cost of overshooting the curve, based on what these two reviews actually describe, is a wasted or blunted result from a longer session, not an injury from the light itself. Treating a trial's published dose as the ceiling rather than the floor is the one change this evidence supports; everything else, including exactly how far the effect declines past that point for any specific home device, is outside what either review measured. "More time under the light always works better" is one of a dozen common claims this site checks against the evidence in its myths-checked guide, and this curve is why that specific one does not hold up.