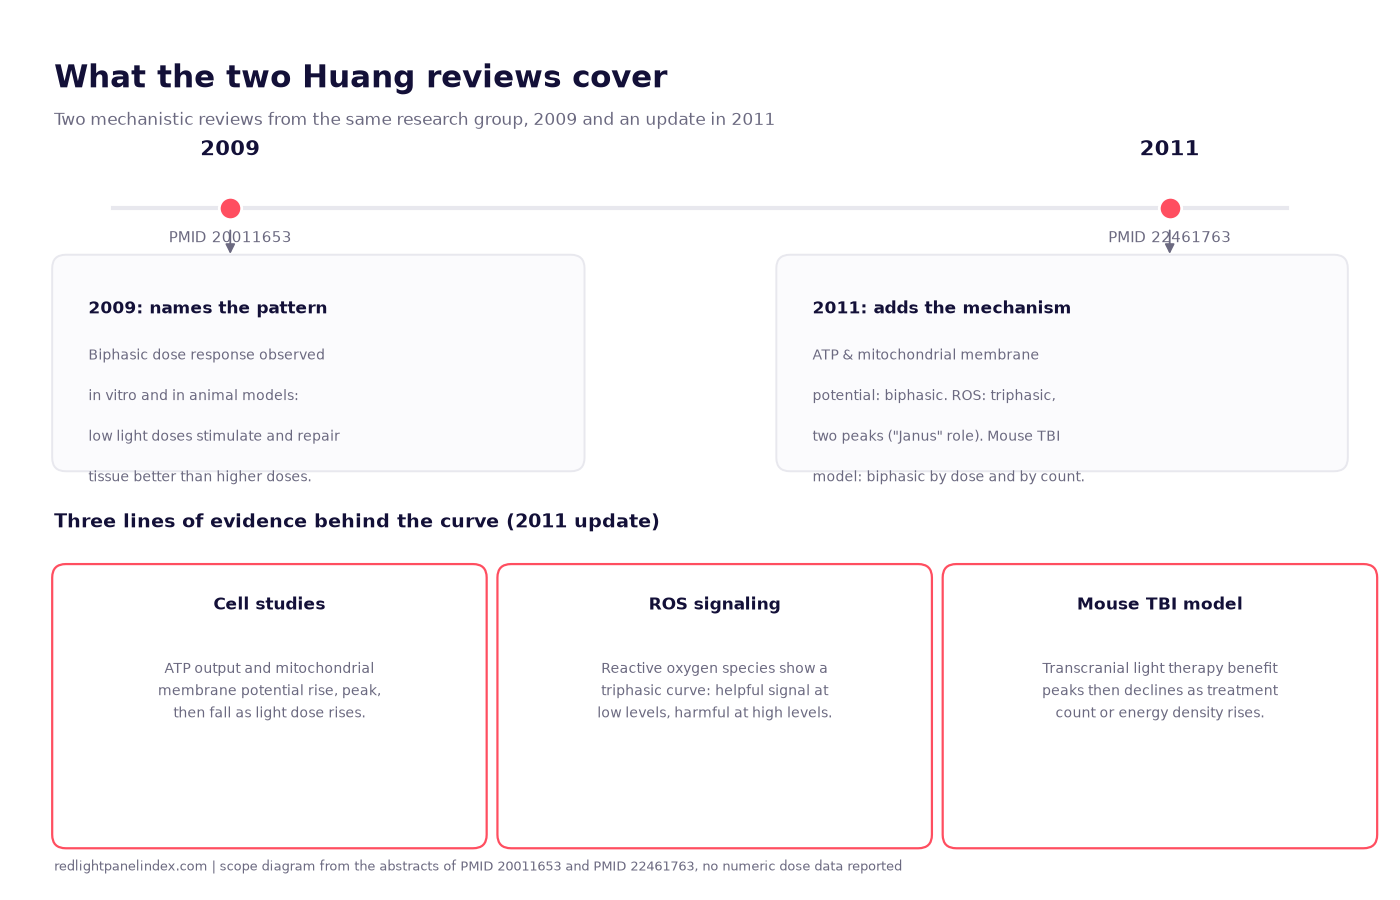
Two mechanistic reviews from the same Wellman Center for Photomedicine research group, one published in 2009 and an update in 2011, describe the biphasic dose response in light therapy: low doses of red or near-infrared light stimulate and repair tissue, while a high enough dose stops helping or works against the same effect (PMID 20011653, PMID 22461763). Neither paper is a clinical trial. Both are narrative reviews that compile cell studies, one animal model and the authors' own prior work into a single argument, and reading them side by side shows how much of that argument rests on in vitro and animal evidence rather than on a home-panel-relevant number.
Choosing a panel? Our ranking of the best red light therapy panels is computed from published, method-labeled specs across 188 devices. For staying inside a sensible dose, the spec that matters is a method-labeled irradiance figure, not a marketing claim.
What the studies asked
The 2009 paper set out to explain a pattern researchers kept running into: low-level laser therapy trials that used a low dose of light tended to report positive results, while some trials that used a higher dose reported weaker or null results, and low-level laser therapy remained controversial in mainstream medicine partly because of that inconsistency. Its question was whether a biphasic, rise-then-fall dose-response curve, borrowed in name from the 19th-century Arndt-Schulz pharmacology principle, could explain the mixed record.
The 2011 update asked a narrower, more mechanistic question: given that the 2009 paper had already described the biphasic pattern, what is actually happening inside a cell, and in a whole organism, as dose rises past the point where benefit peaks? It states directly that it is meant as an update to the 2009 coverage of the same topic, not a new independent study.
Who was studied
Neither paper enrolled human patients or reports a sample size in the way a clinical trial does, because neither is a clinical trial. Both are reviews: the 2009 paper synthesizes findings "from experiments conducted in vitro, in animal models and in randomized controlled clinical trials" that had already been published by others, without listing how many studies it drew on or their individual designs. The 2011 update is narrower and leans more heavily on the authors' own recent results: it describes findings from in vitro cell studies (measuring ATP and mitochondrial membrane potential) and from one specific animal model, mice given transcranial low-level light therapy for traumatic brain injury. No human trial data with its own dose-response analysis is presented in either abstract; the clinical relevance is argued from the cell and mouse findings, not demonstrated in the human trials the papers reference elsewhere in the literature.
That is the central thing to hold onto reading either paper: it is a synthesis and interpretation of a body of separate work, written by researchers who also generated some of the underlying in vitro and mouse data themselves, not a single controlled study with its own participants, arms and outcome measure.
Device and parameters as stated
Because these are reviews rather than single-protocol studies, there is no one wavelength, irradiance or session length to report the way a study review normally would. The 2011 update does name the parameters that varied within its own cited experiments, without giving numeric values for them: in the mouse traumatic brain injury model, the biphasic pattern showed up in two separate variables, "when the number of treatments is varied, and when the energy density of an individual treatment is varied" (PMID 22461763). That is a statement about which dosing variables produced the curve, not a table of doses. Neither paper states a wavelength, a joules-per-cm2 figure, or a device type for the transcranial mouse experiments in the abstract text, and this review does not add one that is not there. This site's overview of red versus near-infrared wavelengths covers the ranges other trials cited on this site actually used, for comparison.
The diagram above lays out what each paper covers rather than a results chart, because neither abstract gives plottable numeric data usable outside the reviews' own in vitro and mouse experiments.
What was measured and found
The 2009 paper's central finding is the pattern itself: "a biphasic dose response has been frequently observed where low levels of light have a much better effect on stimulating and repairing tissues than higher levels of light" (PMID 20011653). It names the Arndt-Schulz curve as the descriptive shape for this pattern and frames the rest of the paper around explaining it mechanistically, without giving a single joules-per-cm2 number as the point where the curve turns over.
The 2011 update reports three specific findings behind that shape. First, at the cellular level, adenosine triphosphate (ATP) production and mitochondrial membrane potential both show a biphasic pattern as light dose increases: they rise, then fall. Second, mitochondrial reactive oxygen species (ROS) show something more complex, a triphasic pattern with two distinct peaks rather than one, which the review attributes to ROS having a "Janus nature," acting as a helpful signaling molecule at low concentrations and a harmful, cell-damaging agent at high concentrations. Third, in the mouse traumatic brain injury model, transcranial light therapy produced "a distinct biphasic pattern with peaks in beneficial neurological effects" as either the number of treatments or the per-session energy density was increased (PMID 22461763). In each of the three findings, benefit rose with more light or more sessions up to a point, then flattened or declined; none of the three is reported with a numeric threshold that translates directly to a home panel's wavelength, irradiance or session length.
Limitations
Both reviews are, by design, synthesis and argument rather than new primary data collection at the human level, so the usual limitations of a review apply: neither abstract states a systematic search method, a number of studies screened, or a way of judging how representative the cited findings are of the wider literature. The 2011 update is more specific about its own contributing experiments, but even there, the traumatic brain injury findings come from a single animal model in mice, not a range of species, tissues or injury types, and neither review reports a numeric energy-density or treatment-count figure for where the mouse model's peak occurred.
Most importantly for a home-panel reader, neither review's abstract gives a wavelength, irradiance or joules-per-cm2 figure that would let anyone calculate a specific ceiling dose for a specific target tissue. The papers argue that such a ceiling exists and varies by tissue and wavelength; they do not publish it. The 2011 update ends by calling for "further understanding of the extent to which biphasic dose responses apply in LLLT" before clinical treatments can be optimized around it, an acknowledgment from the authors themselves that the numbers needed to apply this precisely are still incomplete.
What this means for a home panel
The practical read of both papers together is narrower than "you can overdose on red light" as a standalone warning; it is closer to "more light past a certain point does not add more benefit, and the point where that happens is not published for a home device." This site's longer explainer on the biphasic dose response walks through that distinction and its practical consequences in more depth, including why doses used in an actual published trial, not an assumed higher number, are the closest thing to a defensible target for a home session.
Two of this site's own tools apply that same logic directly. The dose calculator converts a panel's method-verified irradiance and a chosen session length into a J/cm2 figure, which is the only way to know what dose a session is actually delivering rather than guessing from minutes alone. The session length guide works the same formula the other direction, starting from a trial-tested target dose and solving for how long a session needs to run at a given panel's measured output, and the dosing guide lists the specific doses used across the trials this site cites, worked examples included. Neither tool can tell a reader where their own biphasic ceiling sits, because neither Huang review published one; what they can do is keep a session anchored to a dose that has actually been tested, which is the one concrete step these two reviews support.